1 hour ago · SEBI Registration INH000022729
SEBI Registration INH000022729 · 1 hour ago
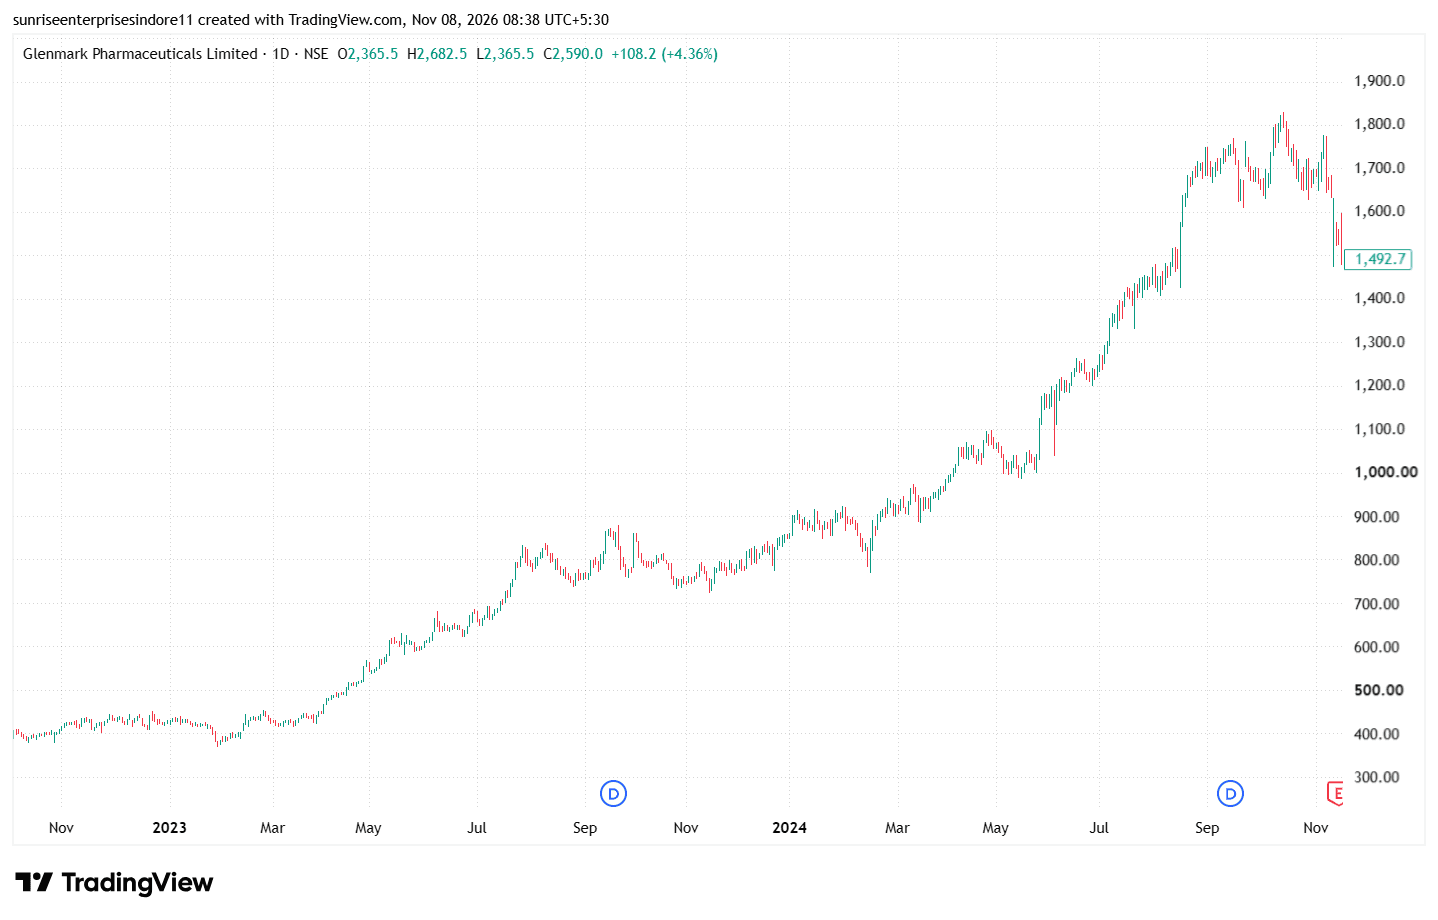
This chart of Glenmark Pharmaceuticals represents
GLENMARK This chart of Glenmark Pharmaceuticals represents a powerful long-term uptrend, characterized by a consistent formation of higher highs and higher lows, which indicates strong buying interest and sustained bullish momentum. The stock has rallied significantly from its earlier base near ₹400, followed by multiple consolidation phases and breakouts, suggesting that buyers have repeatedly absorbed selling pressure and pushed prices higher. Such a stair-step price structure is generally considered a healthy and strong uptrend, particularly when breakouts are supported by volume and previous resistance zones act as support. However, after such an extended rally, sharp corrections and profit booking are normal, and the recent decline indicates weakening short-term momentum. The broader trend remains bullish only as long as important previous swing lows and support zones hold, while a breakdown below key supports could signal a deeper correction or trend reversal. Technical analysis is for educational purposes only, not investment advice.