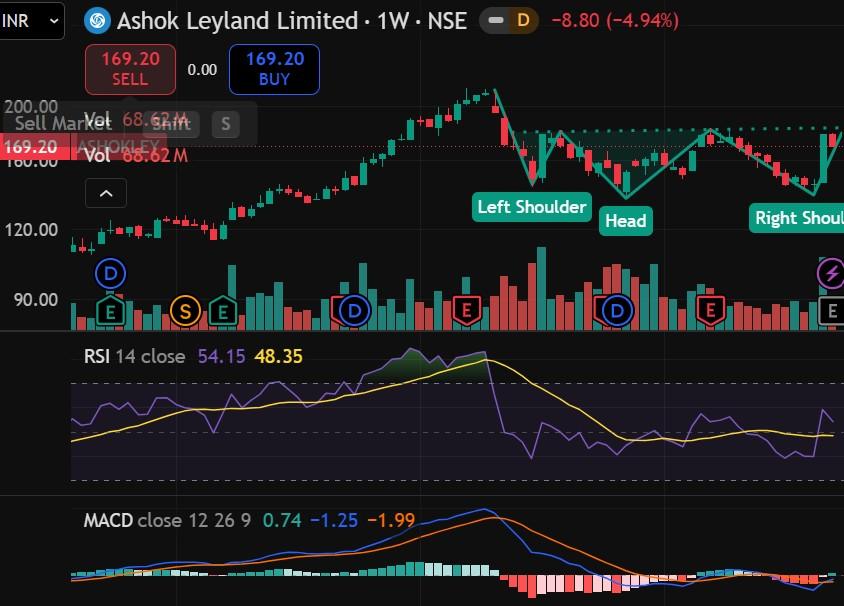
Ashok Leyland Inverted Head and Shoulder Pattern
Ashok Leyland Limited (ASHOKLEY) has been one of the top-performing auto stocks in the Nifty 500 universe, staging a sharp recovery from its late-October swing low of ₹140.01 to test an intraday high of ₹178.83 earlier in November 2026. Following a massive volume-backed rally, the stock closed the week ending November 13, 2026 at ₹169.20. The stock is trading above all its Daily Short term, Medium Term, and Long term Exponential Moving Averages. The Daily MACD Histogram above zero indicates a bullish trend. The Daily RSI 14 above the midline 50 levels at 62.92 also indicates a bullish trend. In weekly charts we can see a Inverted Head and Shoulder Pattern and break out of the same is still pending. The Weekly MACD Histogram has crossed above zero indicating a change in trend and Weekly RSI 14 above the midline 50 levels at 54.15 also indicates a bullish trend. The stock is consistently facing resistance at 181 to 182 zone. We may see more upside once the stock closes above the resistance zone on Daily Charts. ASHOKLEY