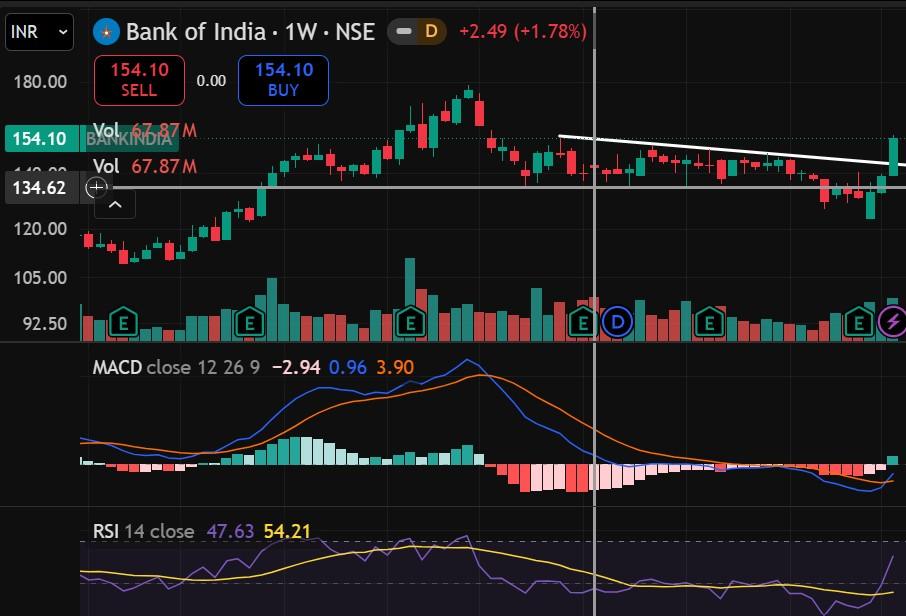
Bank of India Trendline Breakout Weekly Chart Analysis
Bank of India (BANKINDIA) has emerged as one of the standout performers in the Nifty 500 universe for the week ending November 13, 2026. The stock posted a remarkable weekly gain of nearly 13%, closing around the ₹151.20–₹154.10 zone after rebounding sharply from its late-October 52-week low of ₹123.64. From a structural standpoint, Bank of India has reclaimed all its major short-term and long-term moving averages. By decisively crossing above the 50-day Simple Moving Average (near ₹140.89) and the critical 200-day Simple Moving Average (near ₹145.78), the stock has invalidated its previous medium-term falling channel. Technically there is a Three White Soldiers Candle Stick pattern. A trendline breakout on the weekly chart. Weekly RSI 14 has crossed above the midline 50 levels and is at 62.79. Weekly MACD Histogram has crossed above zero and this confluence of indicators indicates a bullish trend in coming days. BANKINDIA