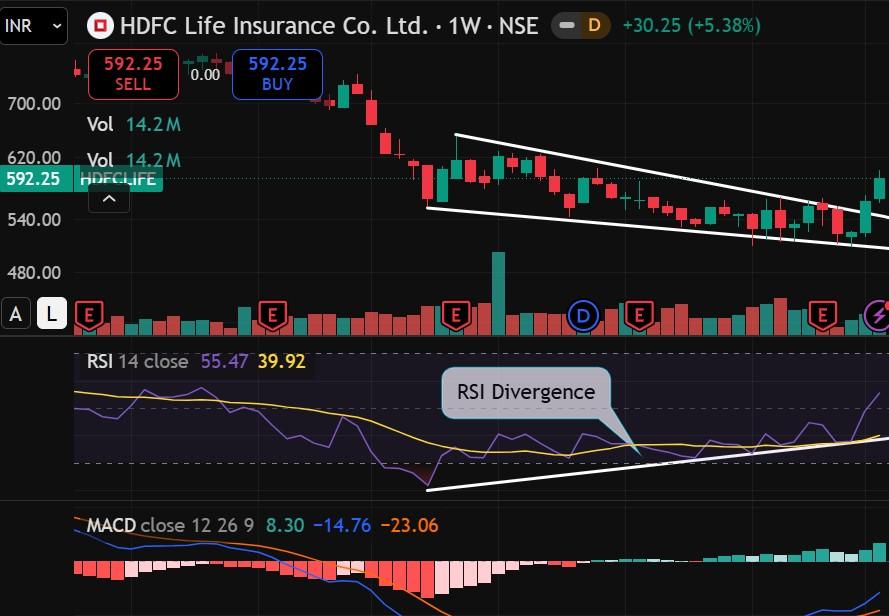
HDFC Life Insurance Trendline Breakout on weekly charts
HDFC Life Insurance Company Limited (HDFCLIFE) has emerged as one of the top weekly gainers in the Nifty 50 basket for the week ending November 13, 2026. After making its 52-week low of ₹508.05 in late October, the stock staged a sharp recovery rally of nearly 16.5% over two weeks, briefly crossing the psychological ₹600 mark to hit an intraday peak of ₹602.30 before settling at ₹592.25. HDFC Life Insurance Company Limited is trading above all its Daily Short Term, Medium Term and Exponential Moving Averages and is able to close above its Long-Term 200 Day Exponential Moving Average for the last two trading sessions. The 200 Day Exponential Moving Average around 590 levels will act as the immideate support. A Bullish RSI Divergence has emerged on the weekly chart. while price printed a lower low, the RSI formed a higher low, signalling fading selling pressure and a potential upward reversal. In the Weekly Charts of HDFC Life Insurance Company Limited, we see a trendline breakout and an entire candle body formation above the trendline after the breakout. After the breakout the Weekly RSI 14 crossed above the midline line 50 levels and is at 55.47 indicating a Bullish Trend. The Weekly MACD Histogram is above the zero-line indicating printing flashing green bars indicating the strength in trend. HDFCLIFE