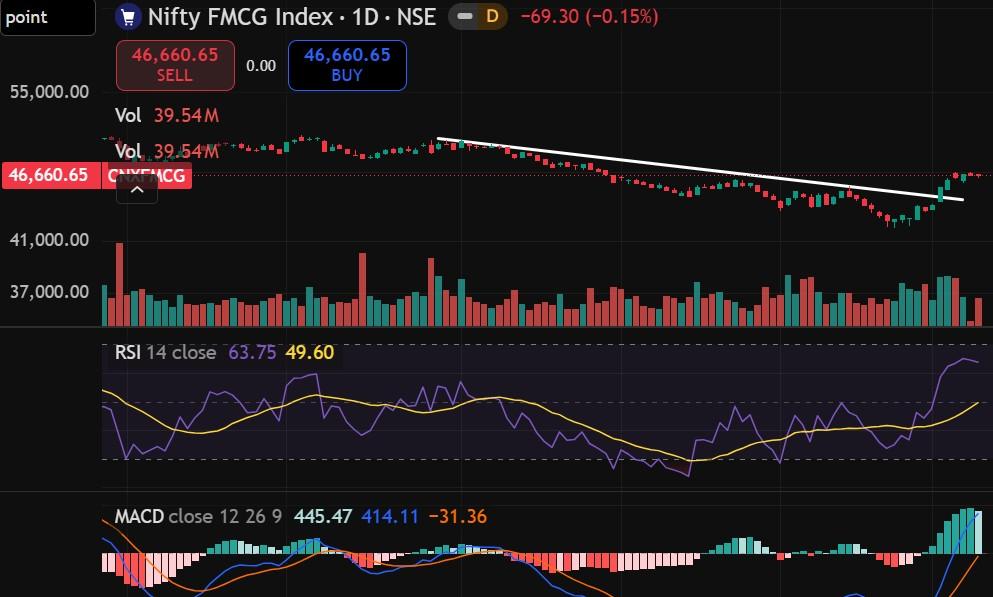
NIFTY FMCG Index Daily Chart Technical Analysis
The Nifty FMCG Index (CMP: 46,660.65) is showing early signs of a structural trend reversal on the daily timeframes. After a massive 20% correction throughout 2026 driven by climbing raw material costs (palm oil, packaging, sugar) and a weak rupee, the defensive heavyweights are finally carving out a clear accumulation base. Nifty FMCG is still below the 200 Day Exponential Moving Average and just above the 100 Day Exponential Moving Average. Thus 200 Day Exponential Moving Average around 48450 to 48500 levels will act as the immideate resistence and 100 Day Exponential Moving Average will act as the immideate support and levels to watch will be around 46000 to 45900. It is comfotably trading above its short term and medium term Exponential Moving Average of 20 Day and 50 Day. Macd Histogram above zero indicates a bullish trend and RSI above 60 also indicates a bullish trend and has enough headroom for upside momentum. It has given a break out above the trendline on Daily charts and is countinuing to hold above the break out levels. The top-performing fast-moving consumer goods (FMCG) stocks leading the index recovery include NESTLEIND, MARICO, PATANJALI. NESTLEIND