NIFTY IT CHART ANALYSIS
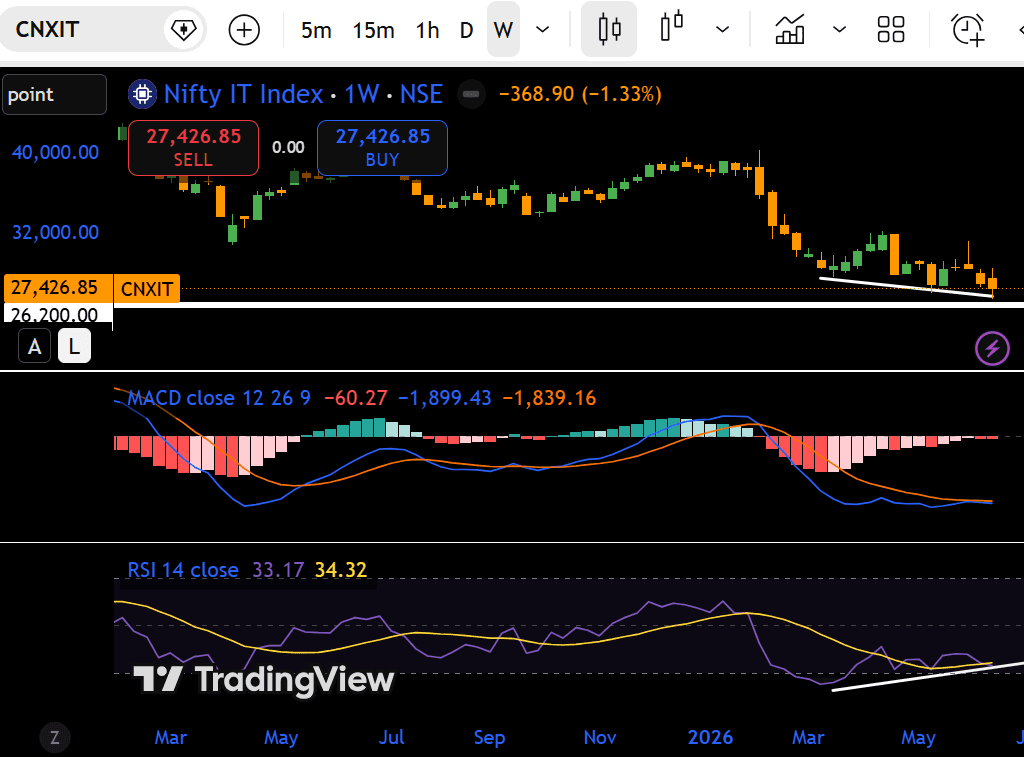
The NIFTY IT Index is currently exhibiting a strong bearish setup, closing down significantly at 27,426.85 on June 19, 2026. This represents a single-day crash of over 3.65% (and over 6.5% from its intraday peaks earlier in the week). RSI below 40 and MACD Histogram below zero indicates more downside can be expected. NIFTY IT Index previously took support around 26200 levels between Jul-2022 to Apr 2023. Thus a weekly close below 26150. We may expect more downside. Interesting observation on the weekly charts is that we are able to see an RSI Divergence while the price is making lower lows. Which indicates that the trend may reverse. Thus a break down of support may move the NIFTY IT Index lower and a weekly MACD Histogram moving above zero may confirm the uptrend in coming days. $INFY $TCS $HCLTECH