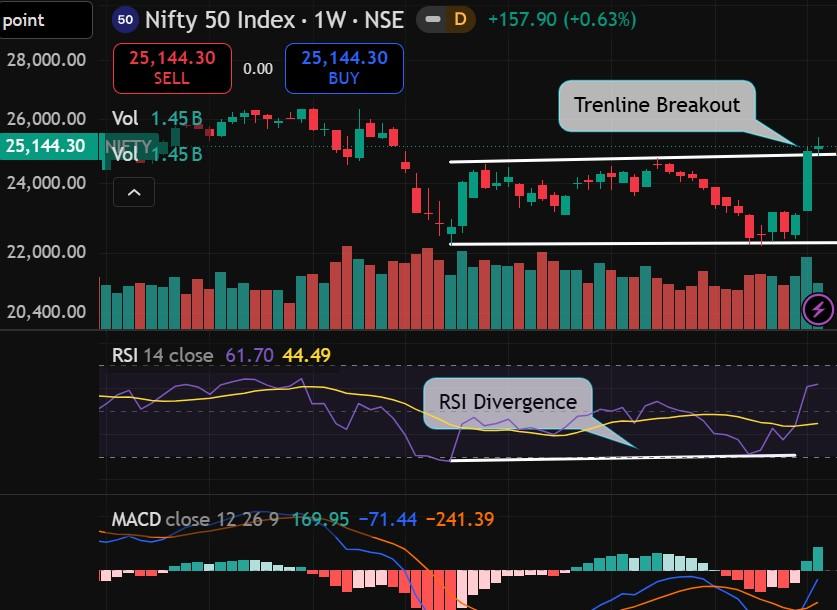
Nifty Trendline Break Out on Weekly Chart
Nifty is trading above all its Daily Short Term, Medium Term and Long-Term Exponential Moving Averages. A bullish moving average crossover has just triggered on the daily chart, with the 20-day Exponential Moving Average crossing decisively above the 200-day Exponential Moving Average, signalling a strong shift in long-term trend momentum. The Daily MACD Histogram above zero and the Daily RSI 14 at 75.22 indicates a bullish trend. But We may see a consolidation or correction before it continues its uptrend as it is in the overbought zone as per RSI 14. In the Weekly Charts of Nifty, we see a trendline breakout and an entire candle body formation above the trendline after the breakout. During the breakout the Weekly RSI 14 crossed above the midline line 50 levels and closed at 60.67 and the Weekly MACD Histogram also crossed above the zero-line indicating a change in trend. On Weekly Charts a bullish RSI divergence has emerged on the daily chart. while price printed a lower low, the RSI formed a higher low, signalling fading selling pressure and a potential upward reversal. We may more upside in comings if Nifty sustains above the trendline and 24800 levels would act as the immediate support. Weekly Top Gainers: SBIN, HDFCLIFE. SBIN