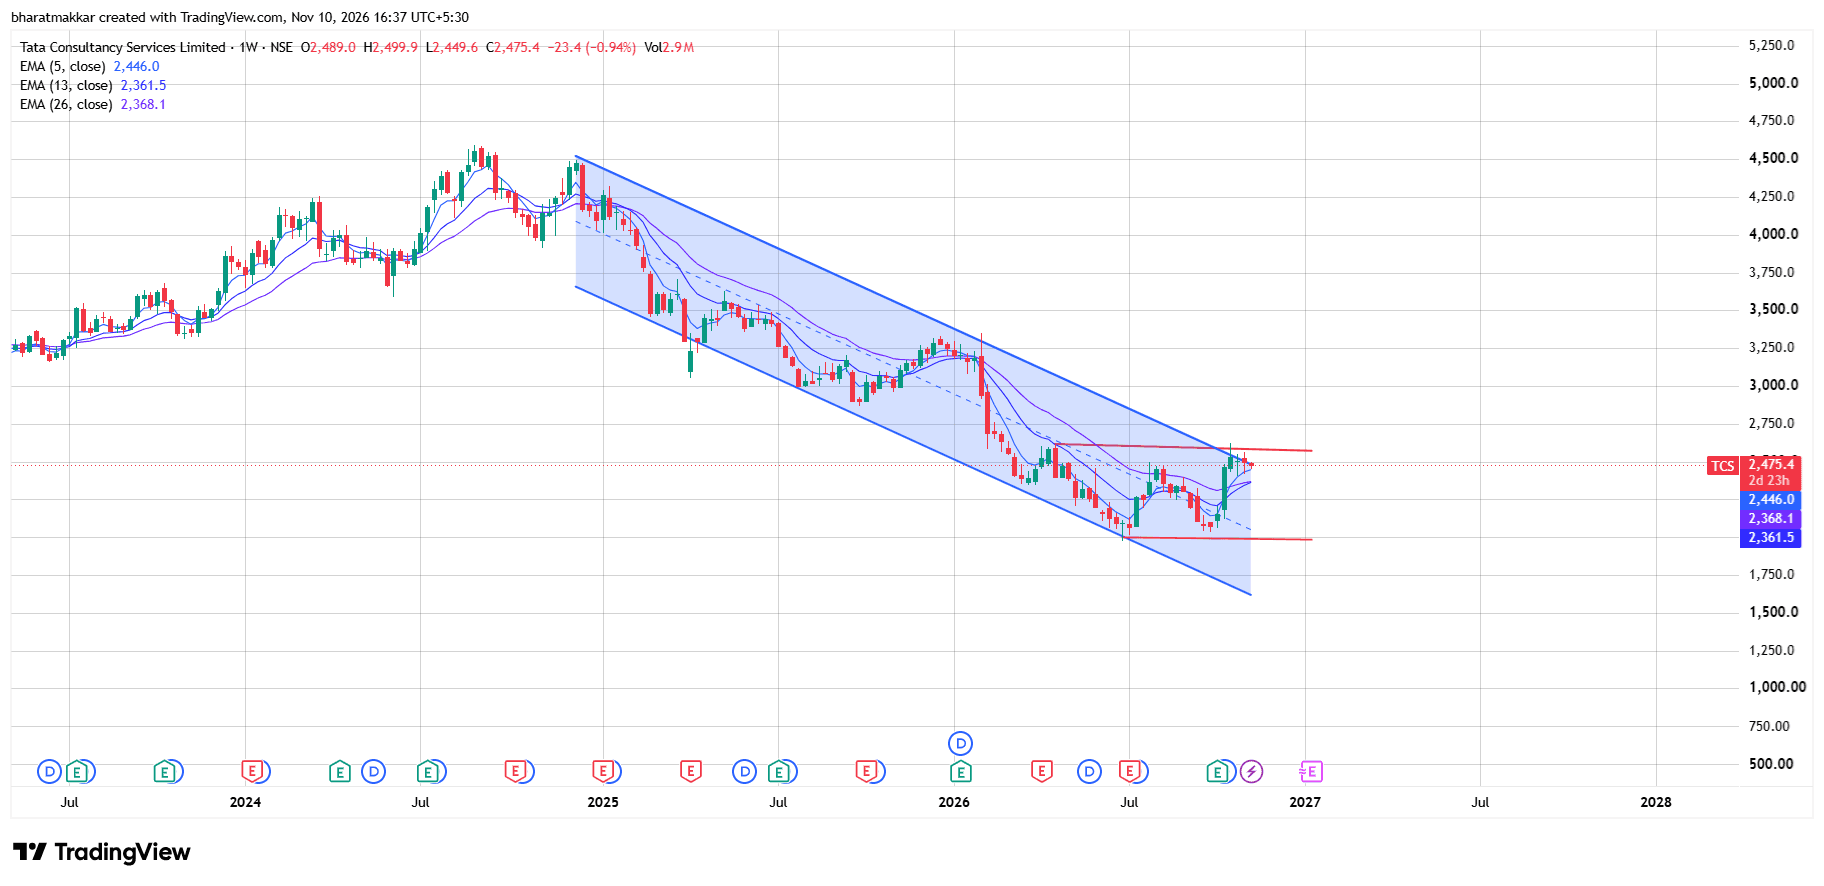
TCS - Major Trend Reversal Awaits Breakout
TCS is showing signs of recovery after a prolonged decline within a well-defined downward-sloping channel. The stock has rebounded from its recent lows near ₹1,900–2,000 and is now trading above its 5-week, 13-week and 26-week EMAs, indicating improving short-term momentum. However, the broader trend remains cautious as the stock approaches a crucial resistance zone around ₹2,550–2,650, which coincides with the upper boundary of its recent consolidation and the declining channel resistance. Key Technical Observations: Trend: Long-term trend remains bearish, but short-term recovery is gaining strength. Moving Averages: Price is above all three EMAs (5, 13 and 26), indicating improving momentum. Resistance: ₹2,550–2,650 is a crucial supply zone. A decisive weekly close above this range could strengthen the bullish case. Support: ₹2,350–2,400 is the immediate support zone, followed by ₹2,000–2,050. A sustained breakout above ₹2,650 could signal a potential trend reversal and open the door for further upside. Failure to cross this resistance may result in renewed consolidation or profit-booking.