Firstsource Solutions Ltd – Technical Setup
(SEBI Reg. INH000019886 | For Educational Purpose Only)
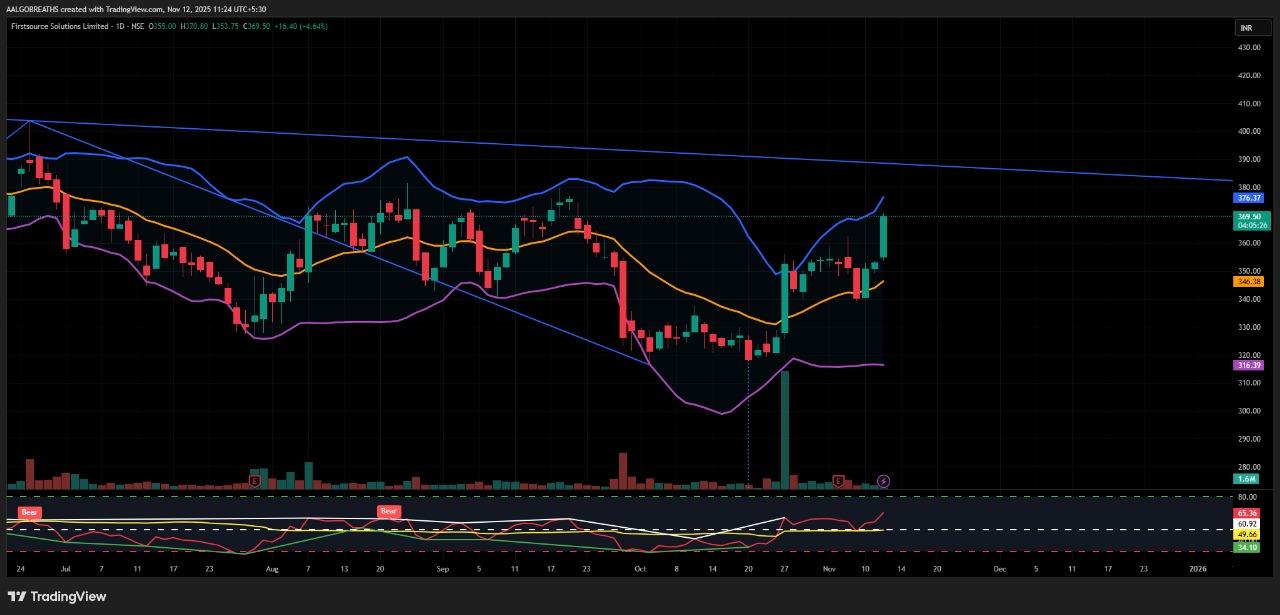
Firstsource Solutions Ltd is showing signs of a strong bottom formation after a prolonged consolidation phase. The stock has rebounded from the lower Bollinger Band and is now sustaining above the 20 EMA and 50 EMA — indicating a possible short-term trend reversal.
Increasing volume activity and RSI crossing above 60 suggest strengthening momentum. On the daily chart, the stock is approaching a descending trendline resistance near ₹375–₹385, where a breakout close above this zone could trigger fresh upside momentum.
📈 Technical Outlook:
Price testing upper Bollinger Band
RSI (~69) entering bullish territory
20 EMA likely to cross above 50 EMA
Expanding volume indicates early accumulation
📌 Key Levels:
Support: ₹345 / ₹320
Resistance: ₹375 / ₹390
Breakout Zone: Above ₹385
Pattern Type: Descending Channel Breakout (in progress)
🎯 Upside Potential:
Once the breakout is confirmed, the stock could move toward ₹420–₹450 in the short term, with a positional projection up to ₹500.
⚠️ Disclaimer: For educational and study purposes only. This is not a buy/sell recommendation.