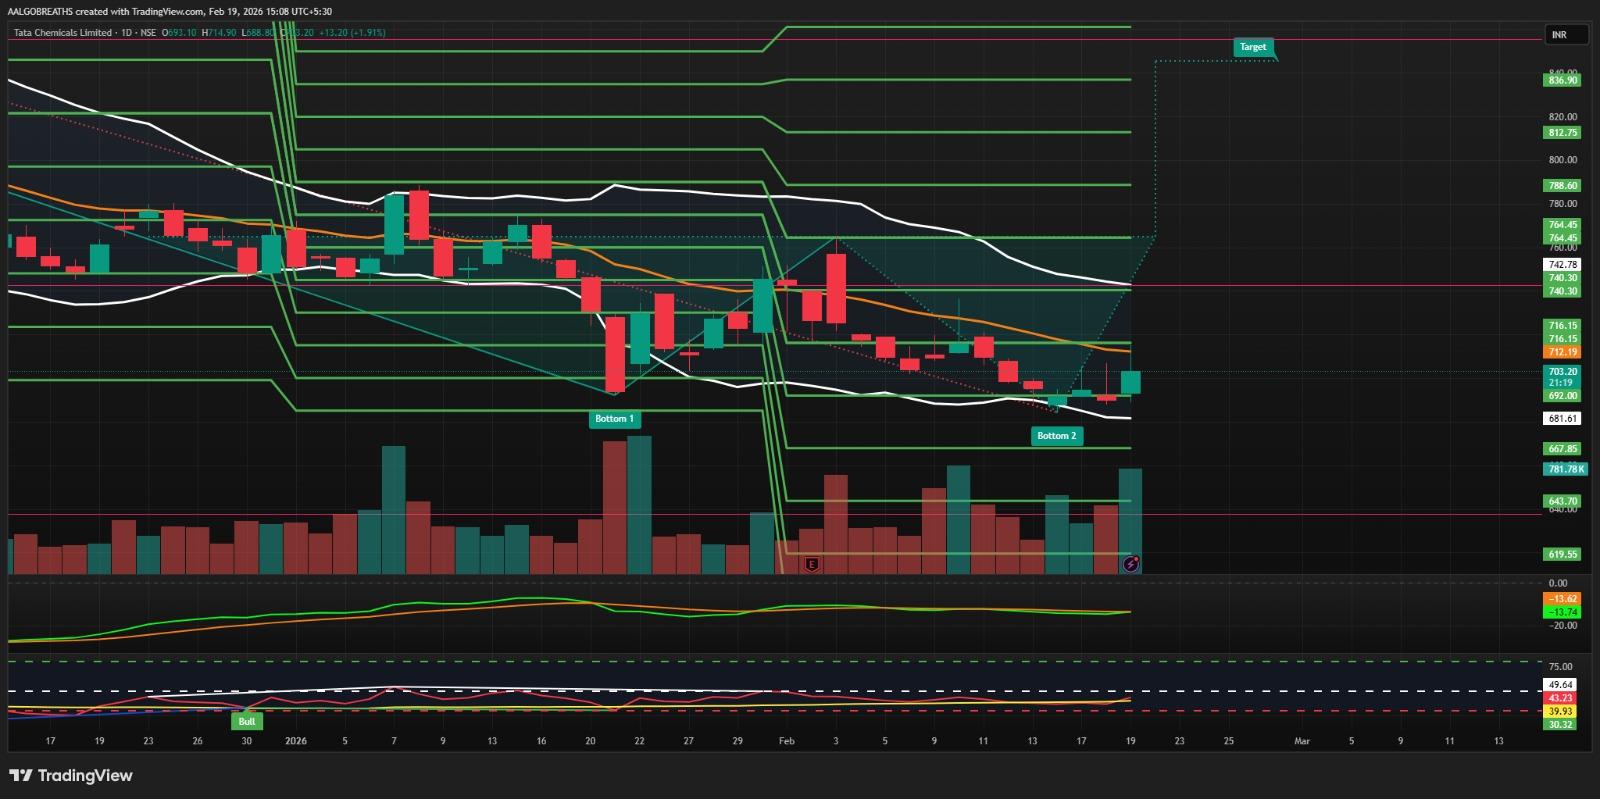
📊 Tata Chemicals Ltd – Double Bottom Formation & Breakout Watch (Daily Chart)
The stock has formed a potential double bottom structure (Bottom 1 & Bottom 2) near the ₹680–₹690 demand zone and is now attempting a recovery toward the neckline resistance.
🔎 Technical Observations:
Clear Double Bottom pattern forming
StrOng support around ₹680–₹690
Price attempting to reclaim 20 EMA
Downtrend line breakout attempt visible
Bollinger Bands tightening (volatility contraction)
RSI gradually recovering from oversold zone
Volume improving near second bottom
🔑 Key Levels to Watch:
Immediate Resistance / Neckline: ₹740–₹750
Major Resistance: ₹765–₹780
Immediate Support: ₹690
Major Support: ₹665–₹645
📈 Bullish Scenario:
Sustained close above ₹750 can confirm double bottom breakout with upside targets:
₹780
₹812
₹840 (pattern projection zone)
⚠️ Bearish Scenario:
Failure to hold ₹680 may invalidate reversal setup and lead to fresh downside pressure toward ₹650 zone.
Currently at a crucial reversal zone — breakout confirmation required.
⚠️ For educational purposes only. Not a buy/sell recommendation.
— AALGO BREATHS