10 mins ago · SEBI Registration INH000019886
SEBI Registration INH000019886 · 10 mins ago
AXIS BANK LTD – Technical Analysis Discussion
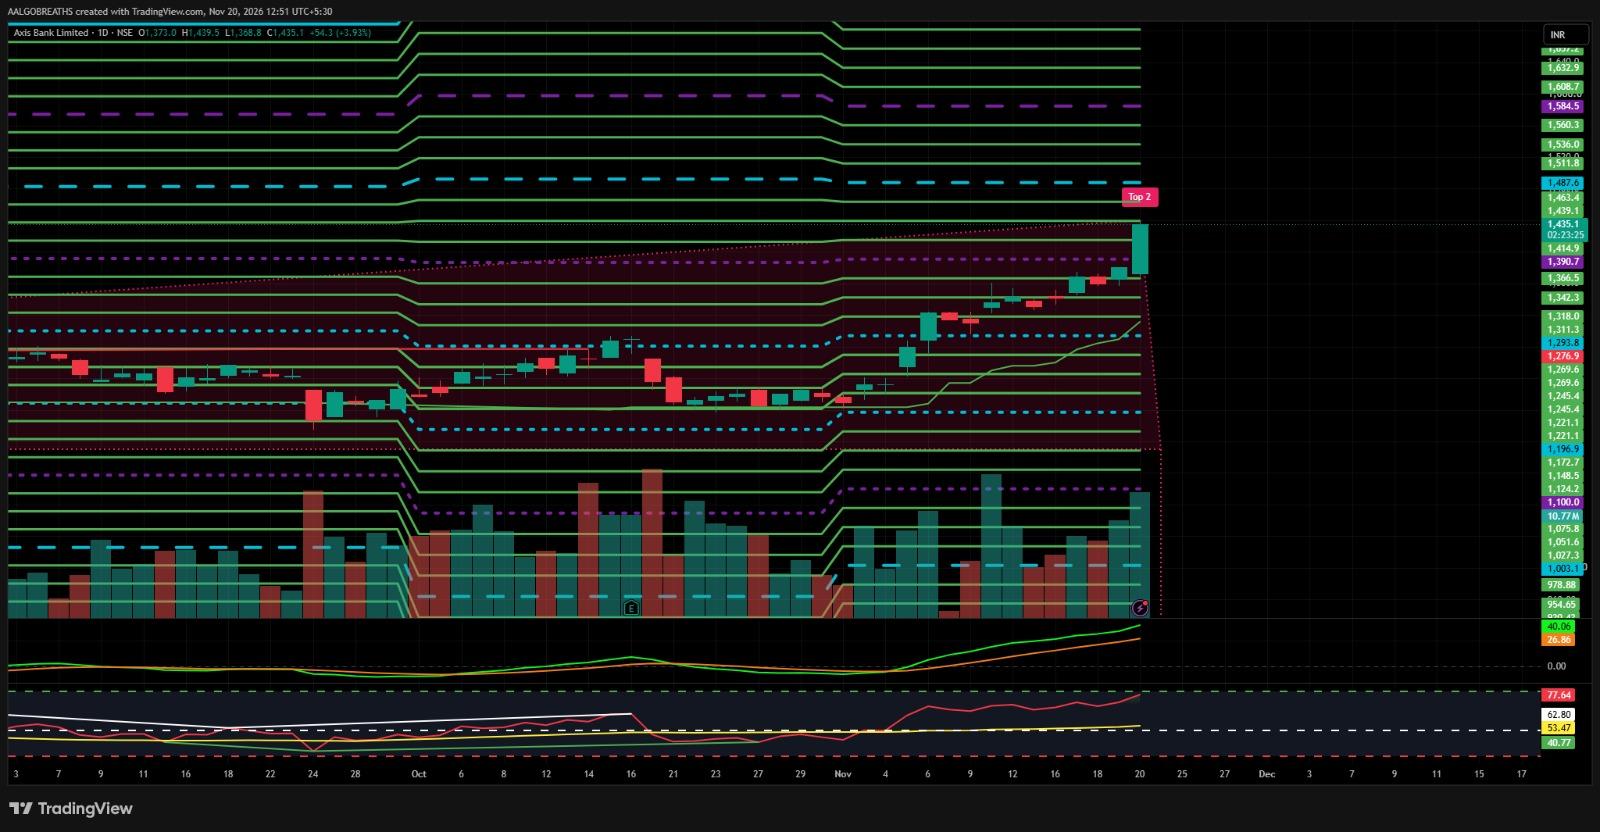
AXISBANK Axis Bank has formed a strong bullish candle on the Daily Chart, closing at ₹1,435.10, up approximately 3.93%. The stock has moved above its recent consolidation zone, indicating strong buying interest and a potential bullish breakout. MACD remains positive, while RSI at 77.64 indicates strong momentum, although some short-term profit booking is possible. A sustained move above ₹1,463 could open further upside towards ₹1,487, ₹1,511, ₹1,536 and ₹1,560. Further strength may extend the rally towards ₹1,584 and ₹1,608. On the downside, ₹1,414–₹1,390 is the immediate support zone, followed by ₹1,366 and ₹1,342. Holding above these levels may help maintain the bullish structure. Resistance: ₹1,463 / ₹1,487 / ₹1,511 / ₹1,536 Upside Targets: ₹1,560 / ₹1,584 / ₹1,608 / ₹1,632 Support: ₹1,414 / ₹1,390 / ₹1,366 / ₹1,342 Trading View: Overall trend remains bullish. Watch for sustained price action above ₹1,463 before considering further upside opportunities. Avoid chasing sharp rallies and maintain proper risk management. ⚠️ Disclaimer: For educational purposes only. Not a buy/sell recommendation. Markets involve risk.