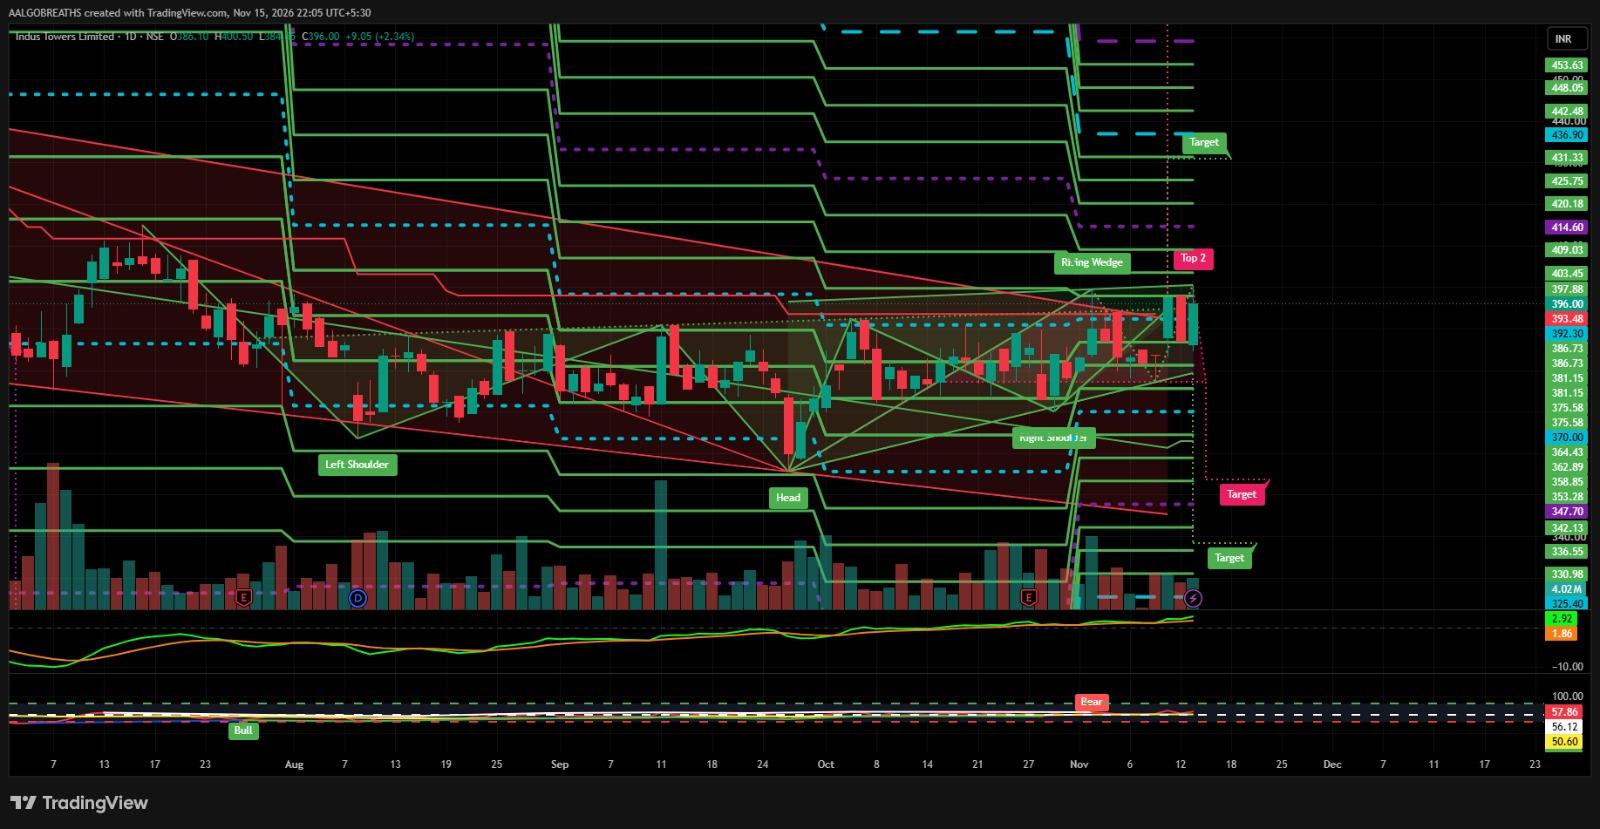
Indus Towers Ltd – Bullish Recovery Discussion
INDUSTOWER Indus Towers Ltd is showing signs of improving price momentum following a recovery from its recent lows. The stock is currently trading around ₹396.00, gaining approximately 2.34%, with buying interest emerging near the recent support zone. The chart indicates a developing bullish structure, with an inverse Head & Shoulders formation and a Rising Wedge pattern visible. However, the price action near the upper trendline and resistance zone requires close monitoring for a confirmed breakout. 🔎 Technical View: • Price has recovered from the recent support zone near ₹364–₹370. • An inverse Head & Shoulders formation suggests a potential bullish reversal. • The Rising Wedge pattern indicates a narrowing price range, making the next breakout or breakdown important. • RSI is around 57.86, reflecting improving positive momentum. • MACD is in positive territory, indicating strengthening momentum. • A sustained move above the immediate resistance zone could improve the short-term technical outlook. 🔑 Key Support Levels: • Immediate Support: ₹392 – ₹386 • Next Support: ₹381 – ₹375 • Major Support: ₹370 – ₹364 • Additional Support: ₹353 – ₹347 🚀 Resistance & Upside Levels: • Immediate Resistance: ₹397 – ₹403 • Next Resistance: ₹409 – ₹414 • Further Resistance: ₹420 – ₹425 • Higher Upside Levels: ₹431 – ₹436 📈 Outlook: Indus Towers is showing a constructive recovery structure, supported by improving momentum indicators. A sustained daily close above ₹403–₹409 could provide further confirmation of bullish strength, potentially opening the way towards ₹414, ₹420 and ₹436. However, failure to cross the upper resistance zone may result in consolidation or a pullback towards ₹386 and ₹375. This technical analysis is based on the chart available as of 15 November 2026 and is for informational purposes only. It does not guarantee future price performance.