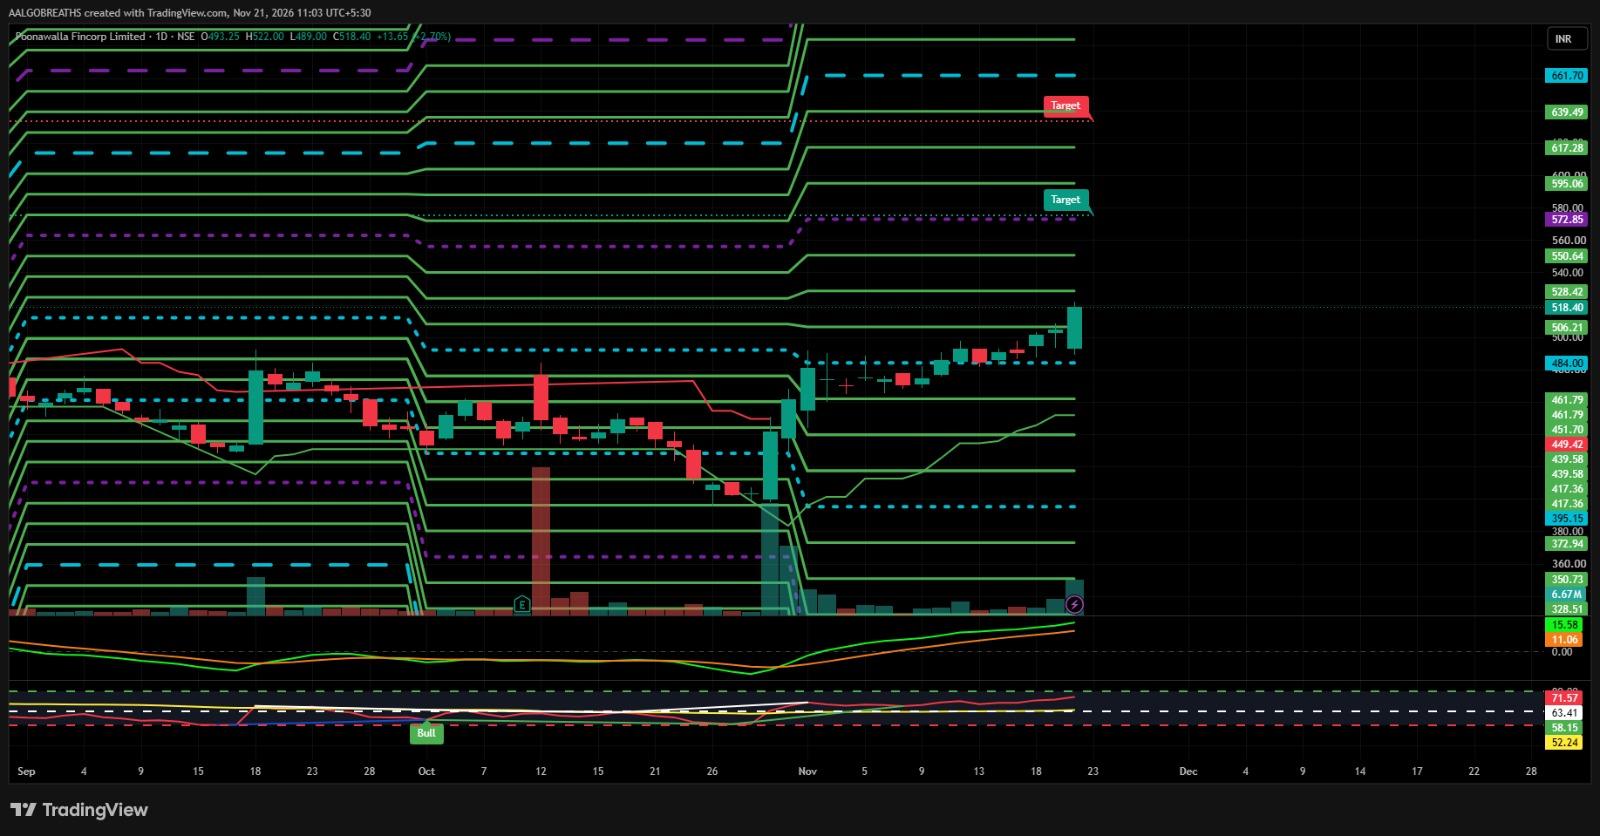
POONAWALLA FINCORP LTD – Technical Analysis
POONAWALLA Poonawalla Fincorp Ltd. is showing a strong bullish structure on the Daily Chart. The stock closed at ₹518.40, gaining approximately 2.70% in the latest session and forming a strong bullish candle. The price has moved above its recent consolidation zone, indicating fresh buying interest and improving bullish momentum. MACD remains positive, supporting the current upward trend. RSI is around 71.57, indicating strong momentum, although some short-term profit booking may occur due to the elevated RSI reading. A sustained move above ₹528.42 could trigger further upside towards ₹550.64, ₹572.85 and ₹595.06. If the bullish momentum continues, the stock may extend its rally towards ₹617.28, ₹639.49 and ₹661.70. On the downside, ₹506.21 is the immediate support level, followed by ₹484.00 and ₹461.79. Holding above these support zones may help maintain the positive technical structure. Resistance: ₹528.42 / ₹550.64 / ₹572.85 / ₹595.06 Upside Targets: ₹617.28 / ₹639.49 / ₹661.70 Key Support: ₹506.21 / ₹484.00 / ₹461.79 / ₹439.58 Trading View: The overall technical outlook remains bullish, supported by positive momentum and strong price action. A sustained breakout above ₹528.42 with volume confirmation may create further upside opportunities. Traders should avoid chasing sharp rallies and maintain proper stop-loss discipline. ⚠️ Disclaimer: This analysis is for educational and informational purposes only. It is not a guaranteed-return or personalized investment recommendation. Please follow proper risk management.