15th Mar 2025 · SEBI-Registered Analyst
Investment Insights with Adarsh · 15th Mar 2025
Candlestick Pattern: PART 1
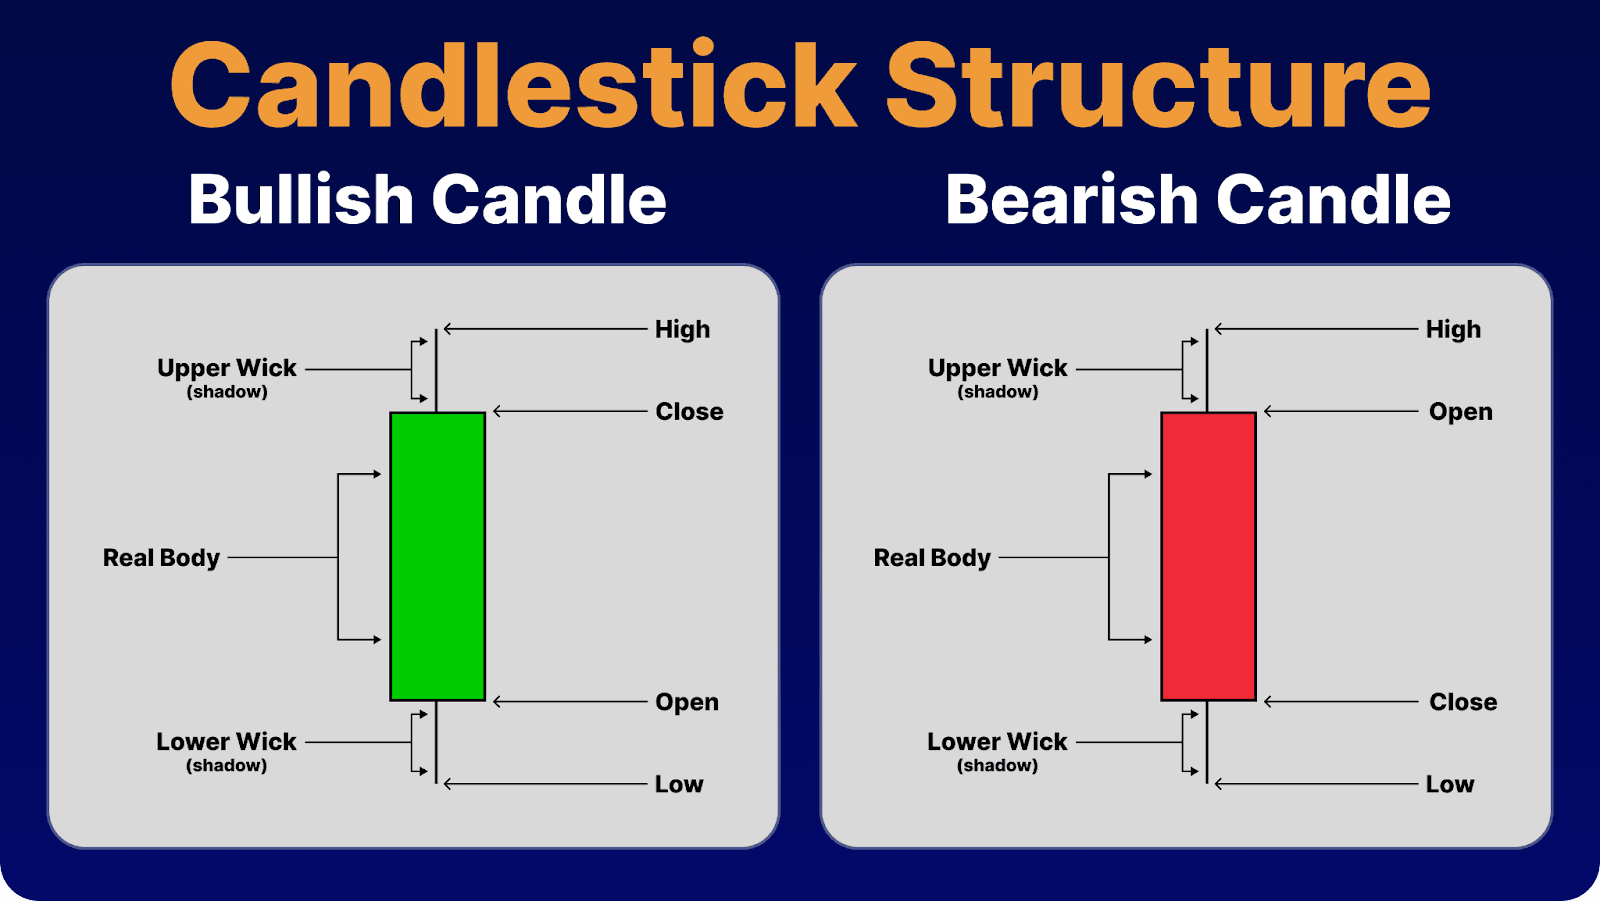
Introduction Candlestick patterns are a fundamental tool in technical analysis, providing insights into market sentiment and potential price movements. Originating from Japanese rice traders in the 18th century, these patterns have become widely used in modern trading for stocks, forex, and commodities. Basic Candlestick Components A candlestick consists of four main price points: 1. Open Price – The price at which the asset starts trading for a given period. 2. Close Price – The final price of the asset at the end of the trading period. 3. High Price – The highest price reached during the trading session. 4. Low Price – The lowest price reached during the trading session. Each candlestick consists of a "body" (difference between open and close prices) and "wicks/shadows" (high and low prices). The color of the candlestick indicates market sentiment: • A green candlestick means the close price is higher than the open price (bullish candle). • A red candlestick means the close price is lower than the open price (bearish candle). Types of Candlestick Patterns Candlestick patterns are classified into two broad categories: 1. Bullish Patterns (Indicating potential upward movement) • Hammer: A small body with a long lower wick, appearing after a downtrend, suggesting a reversal as buyers step in. • Bullish Engulfing: A small bearish candle followed by a large bullish candle engulfing it, indicating strong buying momentum. 2. Bearish Patterns (Indicating potential downward movement) • Shooting Star: A small body with a long upper wick, appearing after an uptrend, suggesting selling pressure and a potential reversal. • Bearish Engulfing: A small bullish candle followed by a large bearish candle engulfing it, signaling strong selling momentum. • Evening Star: A three-candle pattern where a small-bodied candle follows a bullish candle and is succeeded by a strong bearish candle, indicating trend reversal. READ MORE IN PART 2