4th May 2025 · SEBI-Registered Analyst
Investment Insights with Adarsh · 4th May 2025
Candlestick Patterns in Technical Analysis
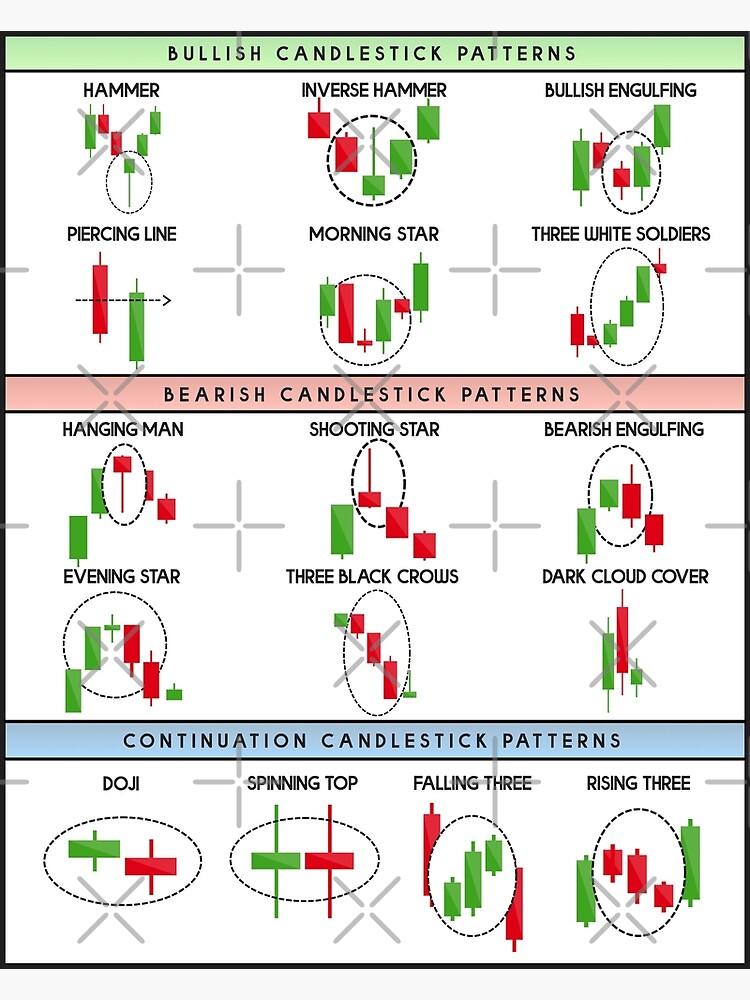
Candlestick charts are one of the most popular tools for visualizing and analyzing stock price movements. Each “candle” provides insight into market sentiment during a specific time period and helps traders predict future price direction. What is a Candlestick? A candlestick shows four key pieces of data for a specific time frame: • Open price • Close price • High price • Low price The body shows the range between open and close. The wicks (or shadows) show the highs and lows. Common Single Candlestick Patterns 1. Doji o Open and close prices are nearly equal. o Indicates indecision in the market. o Could signal a reversal if seen after a strong trend. 2. Hammer o Small body at the top with a long lower wick. o Appears after a downtrend, suggests potential bullish reversal. 3. Inverted Hammer o Small body at the bottom with a long upper wick. o Bullish signal, especially after a decline. 4. Shooting Star o Like an inverted hammer but appears after an uptrend. o Indicates potential bearish reversal. Common Multiple Candlestick Patterns 1. Bullish Engulfing o A small red candle followed by a large green candle that fully "engulfs" the first. o Indicates strong buying pressure and potential reversal upward. 2. Bearish Engulfing o A small green candle followed by a large red candle engulfing it. o Suggests increasing selling pressure. 3. Morning Star o Three candles: a large red, a small-bodied candle (indecision), and a large green. o Strong bullish reversal signal. 4. Evening Star o Opposite of Morning Star. o Appears at the top of an uptrend and signals bearish reversal. 5. Three White Soldiers o Three consecutive long green candles. o Strong bullish signal after a downtrend. 6. Three Black Crows o Three long red candles. o Indicates strong bearish momentum.