3rd Mar 2025 · SEBI-Registered Analyst
Investment Insights with Adarsh · 3rd Mar 2025
Double Bottom Pattern: PART 1
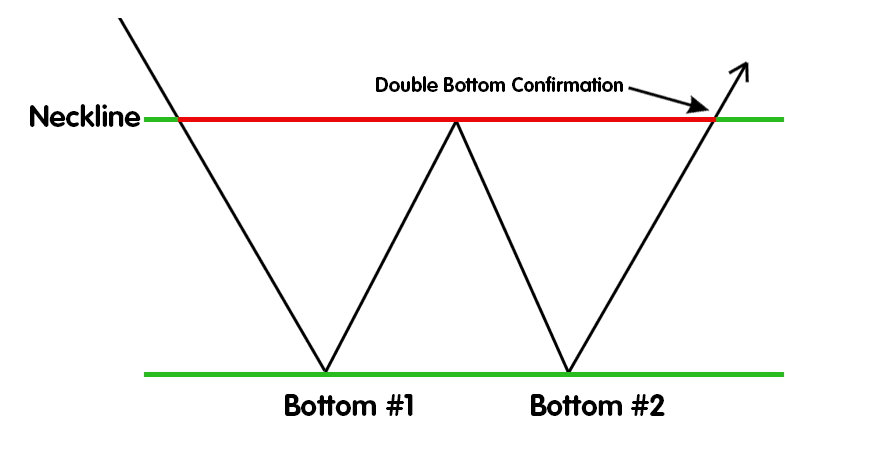
1. Definition The Double Bottom pattern is a bullish reversal pattern that occurs after a downtrend. It resembles the letter "W," where the price touches a low point twice before reversing upward. 2. Structure of the Pattern First Bottom: The price falls to a low, finds support, and bounces up. Interim High (Neckline): After the bounce, the price moves up but faces resistance at a certain level (the "neckline"). Second Bottom: The price drops again but finds support near the first bottom, forming a second low. Breakout: Once the price moves above the neckline with strong volume, it confirms the pattern and signals a trend reversal. 3. Key Characteristics Depth: The two bottoms should be nearly equal in price but allow for slight variations. Time Duration: The pattern can take weeks to months to form, depending on the timeframe. Volume Confirmation: Volume usually declines during the formation and spikes during the breakout. Neckline Resistance: This is the level that must be broken for a confirmed reversal. 4. Entry and Exit Strategies Entry: o Enter when the price breaks above the neckline with strong volume. o Conservative traders wait for a retest of the neckline after breakout. Price Target Calculation: o Measure the distance from the neckline to the bottom. o Add that distance to the breakout level. Formula: Target = Neckline + (Neckline - Bo om) Stop Loss Placement: o Below the second bottom or slightly below the neckline to manage risk. part 2 will come in evening stay tuned