5th Mar 2025 · SEBI-Registered Analyst
Investment Insights with Adarsh · 5th Mar 2025
Falling Wedge: PART 1
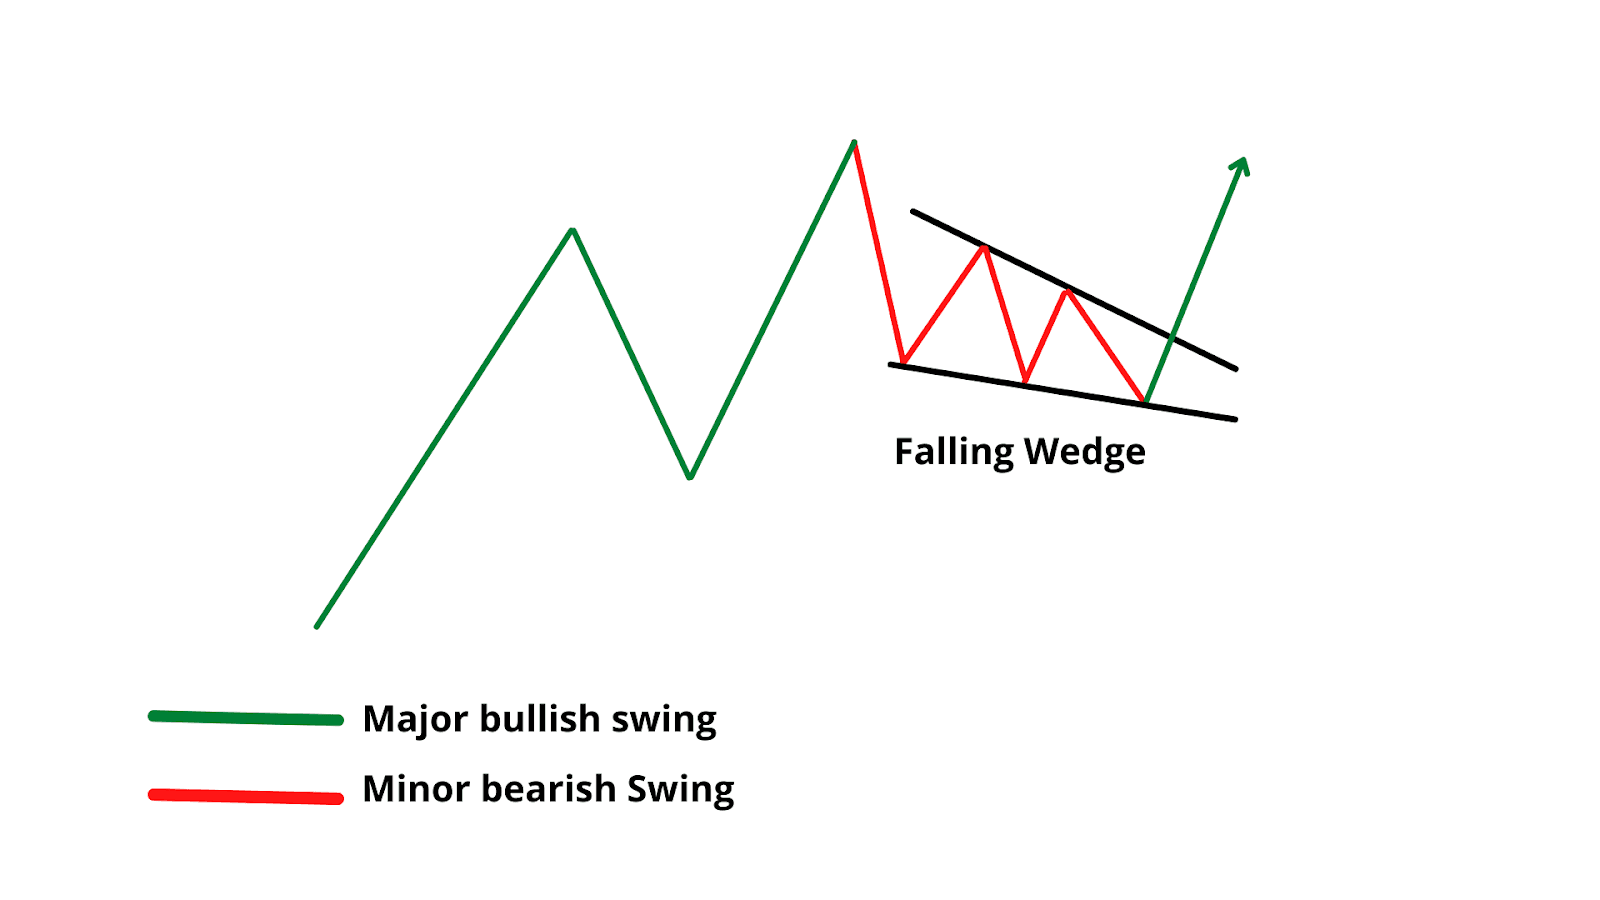
One interesting chart pattern to explore is the "Falling Wedge". This is a continuation pattern, typically signaling a reversal from a downtrend to an uptrend. Here's a comprehensive breakdown: 1. What is a Falling Wedge ? A Falling Wedge is a chart pattern that forms when the price moves within two converging trendlines, with the upper trendline sloping downward at a steeper angle than the lower trendline. It generally appears in a downtrend and indicates that the sellers are losing their strength. As a result, the price may eventually break out to the upside, signaling a potential trend reversal. • Formation: It starts with a sharp downtrend followed by a consolidation period in which the price forms lower highs and lower lows, but the lows are decreasing at a slower pace than the highs. 2. Characteristics of a Falling Wedge: • Trendlines: The pattern is bounded by two converging trendlines. The upper trendline (resistance) slopes downward, and the lower trendline (support) slopes upward or at a slower pace than the upper trendline. • Volume: Volume tends to decrease as the pattern progresses. This indicates a slowdown in selling pressure, signaling a potential reversal. • Timeframe: Falling wedges are most commonly seen on longer timeframes (e.g., daily or weekly charts), but they can also occur on shorter timeframes. 3. How to Identify a Falling Wedge: • Converging Trendlines: Look for a pattern where the price is moving between two trendlines. The price should be making lower highs and lower lows, but the rate of decline for the lows should be slower than the highs. • Price Compression: The price moves in a tight range with narrowing highs and lows. As the pattern forms, it represents a contraction in volatility. • Volume Decrease: Volume typically decreases as the price continues to make lower lows and lower highs. READ PART 2 IN EVENING FOR MORE DETAILS THANK YOU