17th Mar 2025 · SEBI-Registered Analyst
Investment Insights with Adarsh · 17th Mar 2025
FIBONACCI RESTRACEMENT: PART 1
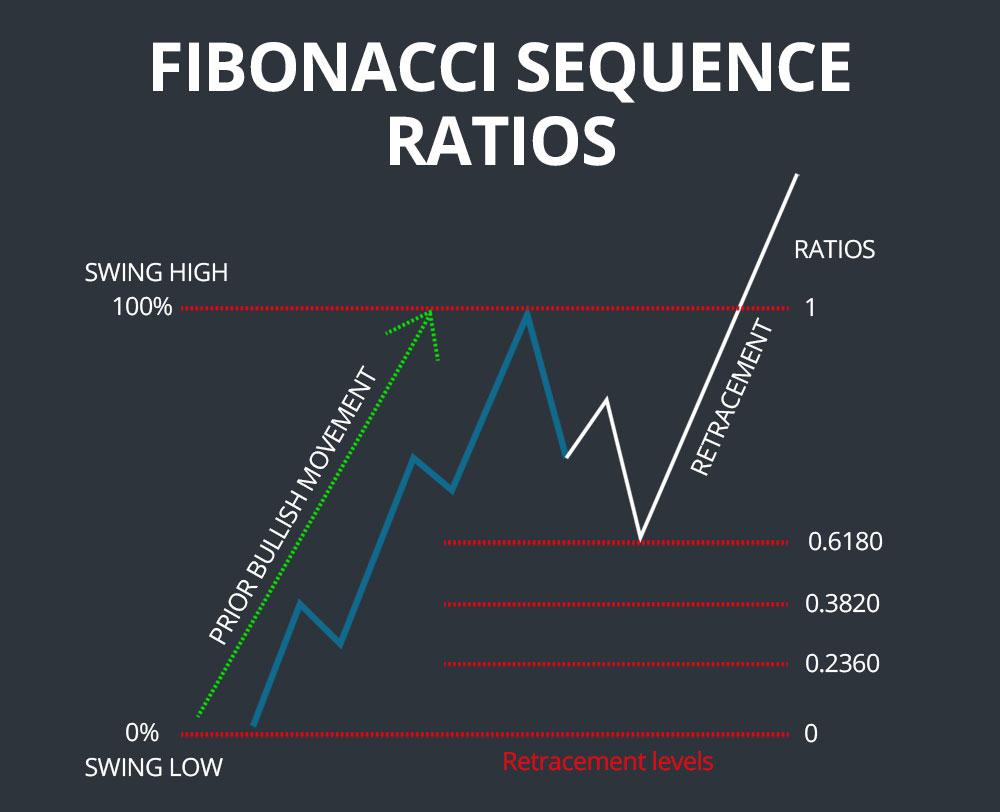
Fibonacci retracement is a technical analysis tool used by traders to identify potential support and resistance levels in a financial asset's price movement. It is based on the Fibonacci sequence, where each number is the sum of the two preceding ones (0, 1, 1, 2, 3, 5, 8, 13, 21, etc.). The key Fibonacci ratios, derived from the sequence, are: • 23.6% • 38.2% • 50% (Note: This is not a Fibonacci ratio, but is commonly used in retracement analysis) • 61.8% • 78.6% How Fibonacci Retracement Works: Traders use the Fibonacci retracement tool to plot horizontal lines at key Fibonacci levels between a high and low price. These levels can act as potential support or resistance zones. Here's how it's generally applied: 1. Identify a trend: Determine the trend direction (uptrend or downtrend). The Fibonacci retracement tool is typically used during a pullback or correction in the middle of a larger trend. 2. Plot the Fibonacci levels: o in an uptrend, you plot the Fibonacci levels from the low point (beginning of the move) to the high point (end of the move). o in a downtrend, you plot from the high point (beginning of the move) to the low point (end of the move). 3. Look for potential reversal points: Once you have plotted the Fibonacci retracement levels, the price may encounter support or resistance around these levels. Traders often watch these zones closely for signs of price reversal or continuation. How to Use Fibonacci Retracement: • Support and Resistance: The key Fibonacci levels (38.2%, 50%, and 61.8%) are often seen as potential support or resistance areas. • Entry and Exit Points: Traders may use these levels to set entry points for buying or selling, or to place stop-loss and take-profit orders. • Confluence with Other Indicators: Fibonacci retracement levels are often used in conjunction with other technical analysis tools, such as moving averages, trend lines, or candlestick patterns, to confirm potential reversal zones. next PART IMP read it.