5th May 2025 · SEBI-Registered Analyst
Investment Insights with Adarsh · 5th May 2025
Gap Analysis in Stock Trading
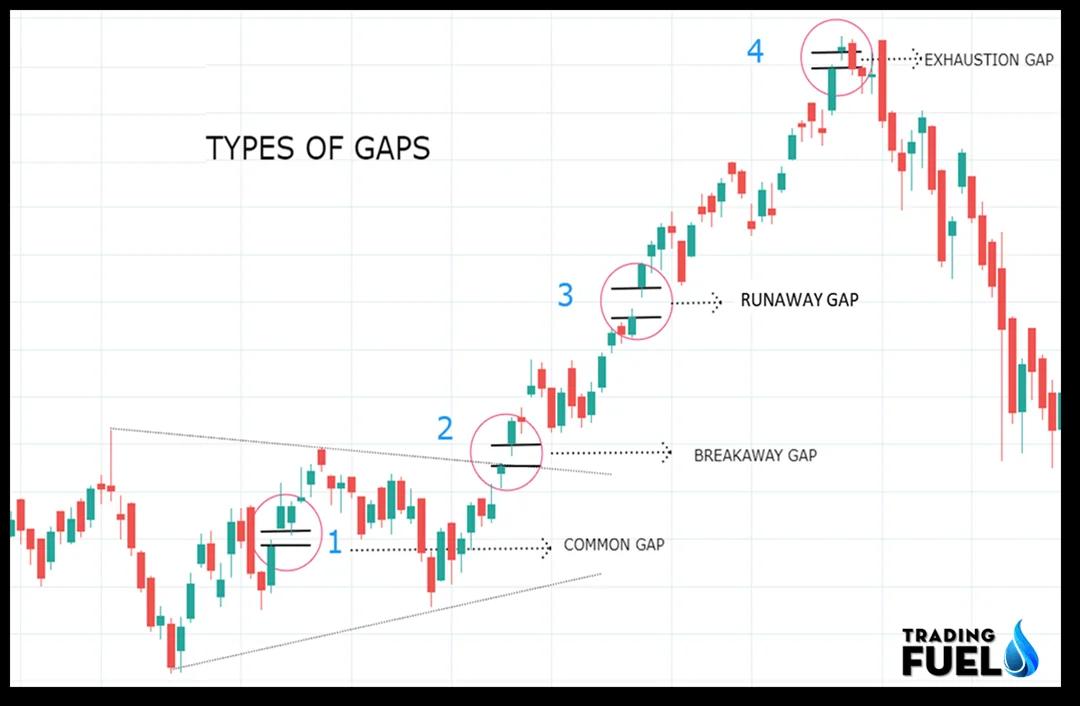
Gap analysis refers to studying the areas on a stock chart where the price sharply moves up or down with little to no trading in between. These are seen as "gaps" on the chart and can signal potential opportunities or risks for traders. Types of Gaps 1. Common Gap Occurs in normal trading with no major news or events. Often gets “filled” quickly as price returns to previous levels. 2. Breakaway Gap Happens at the end of a consolidation phase or pattern. Signals the start of a new trend. Often accompanied by high volume. 3. Runaway (Continuation) Gap Appears in the middle of a strong trend. Confirms trend strength and usually doesn’t get filled soon. 4. Exhaustion Gap Forms at the end of a strong trend. Followed by a reversal. Volume is typically very high, but momentum fades soon after. Why Gaps Matter • Indicate strong sentiment changes — either bullish or bearish. • Provide entry or exit points for short-term traders. • Can be support or resistance zones once formed. Gap Filling Many gaps get “filled” — meaning the price returns to the original level where the gap started. This happens because: • Traders take profits • Overreaction to news settles • Market seeks equilibrium How Traders Use Gaps • Breakaway gap on high volume = enter with the trend. • Exhaustion gap = watch for reversal setups. • Use stop losses and volume analysis to avoid false signals.