16th May 2025 · SEBI-Registered Analyst
Investment Insights with Adarsh · 16th May 2025
PEG Ratio – Price/Earnings to Growth Ratio
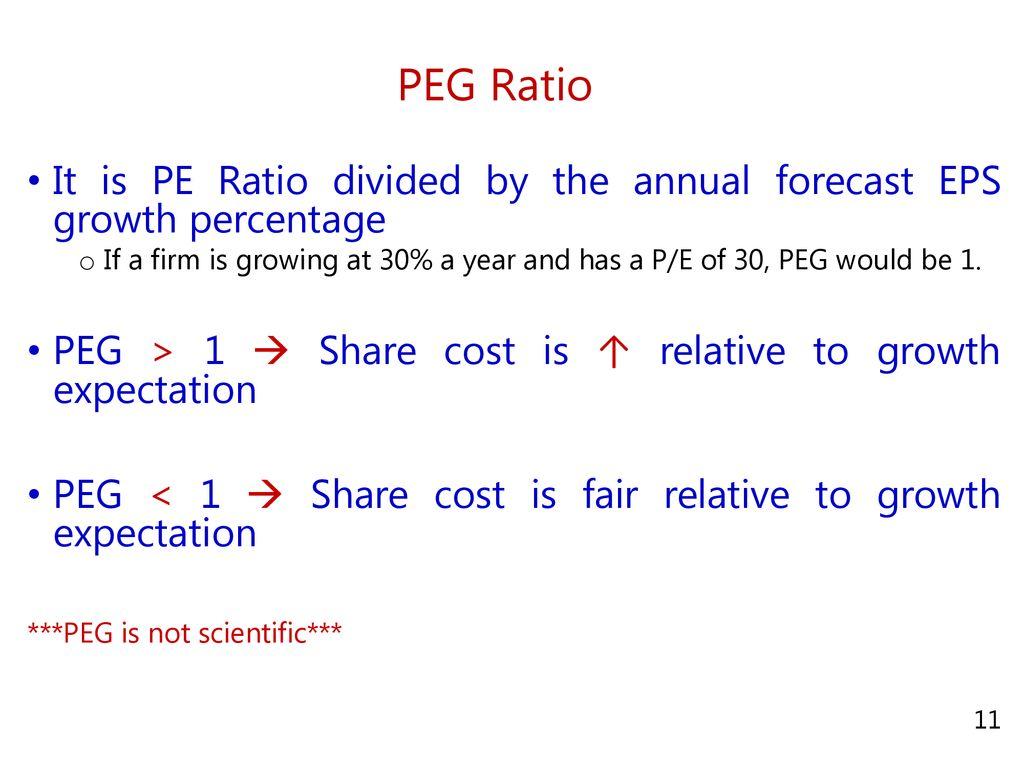
What is the PEG Ratio? The PEG Ratio is a powerful tool used by investors to evaluate whether a stock is fairly priced relative to its expected earnings growth. While the P/E (Price-to-Earnings) ratio tells you how much investors are willing to pay per rupee of earnings, the PEG ratio adds another important dimension: growth. A stock might seem expensive based on P/E alone, but if the company is growing earnings rapidly, it might still be a bargain. The PEG ratio helps uncover that nuance. Formula: PEG Ratio = (P/E Ratio) ÷ (Earnings Growth Rate %) This means you're dividing the price-to-earnings ratio by the percentage of projected annual earnings growth. Example Calculation: If a company has a P/E of 25 and expects to grow its earnings at 20% annually, then: PEG = 25 ÷ 20 = 1.25 What Does It Tell You? • PEG < 1 → The stock may be undervalued relative to its growth. • PEG = 1 → The stock is considered fairly valued. • PEG > 1 → The stock might be overvalued, as growth doesn't justify the price. Real-Life Example: Let’s compare two hypothetical companies: • Company A: o P/E = 30 o Expected EPS growth = 40% o PEG = 30 ÷ 40 = 0.75 • Company B: o P/E = 15 o Expected EPS growth = 5% o PEG = 15 ÷ 5 = 3.0 Although Company A has a higher P/E, it’s growing fast and may actually be a better buy than Company B. This is what makes PEG such a valuable ratio — it gives context to price. Benefits of Using the PEG Ratio: • Helps identify growth at a reasonable price (GARP). • Useful when evaluating growth stocks or companies with future potential. • More accurate than P/E alone in dynamic sectors like technology, pharma, or consumer services. Limitations to Be Aware Of: • Heavily depends on forecasts, which can be inaccurate or overly optimistic. • Doesn’t factor in company debt, cash flow health, or macroeconomic risks. • Not ideal for companies with flat or negative growth, such as utilities or cyclical businesses.