12th Mar 2025 · SEBI-Registered Analyst
Investment Insights with Adarsh · 12th Mar 2025
Rectangle Chart Pattern: PART 1
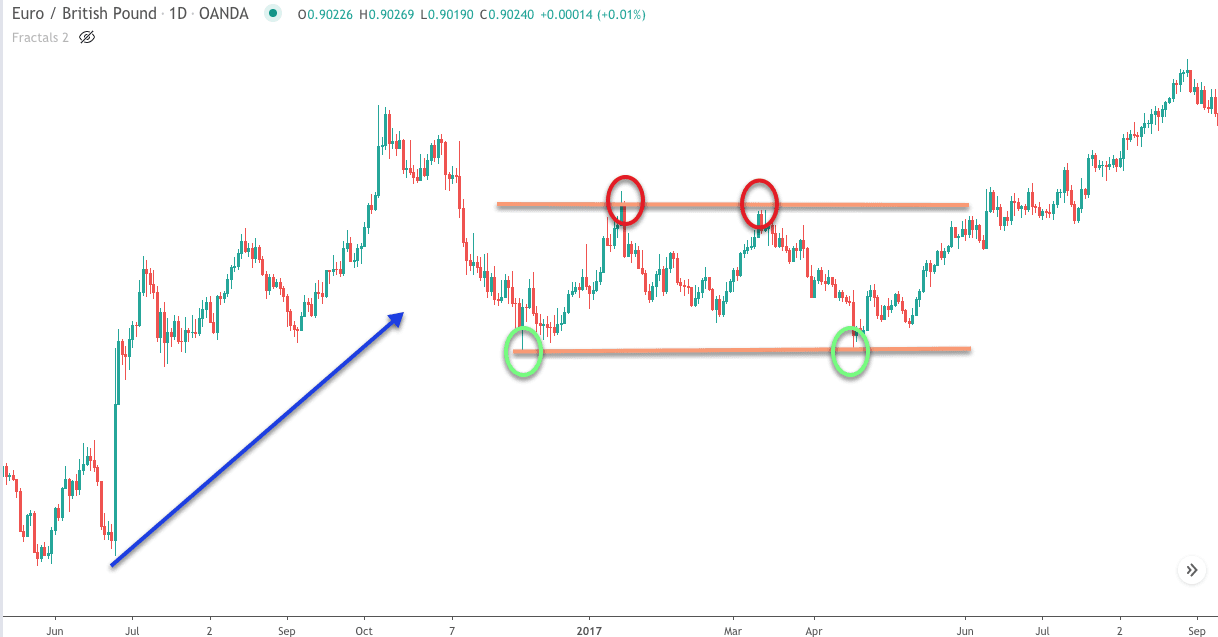
Rectangle Chart Pattern: Detailed Analysis 1. What is a Rectangle Pattern? The rectangle pattern is a consolidation pattern that forms when the price of an asset moves within a defined range, characterized by horizontal support and resistance levels. It is a neutral pattern that suggests indecision in the market between buyers and sellers, often resulting in a breakout in either direction once the price leaves the range. 2. Formation of a Rectangle Pattern A rectangle pattern occurs when the price consolidates between two horizontal levels: • Upper Resistance Level: The highest price point within the range, where selling pressure prevents the price from going higher. • Lower Support Level: The lowest price point within the range, where buying pressure prevents the price from dropping further. This pattern is often seen after a strong trend (either up or down), and it indicates a pause in the trend. The price moves back and forth between the support and resistance levels, typically creating several swing highs and swing lows. 3. Key Characteristics of a Rectangle Pattern • Horizontal Trendlines: o The resistance line marks the upper boundary of the range. o The support line marks the lower boundary of the range. • Consolidation: During the formation of the rectangle, price swings within the range, respecting the support and resistance levels. • Volume: Volume tends to decrease during the consolidation phase. When the price breaks out of the rectangle, volume typically increases, confirming the breakout. • Duration: The duration of the rectangle can vary from a few days to several months. The longer the price stays within the rectangle, the more significant the breakout is likely to be once it occurs. READ PART 2 FOR MORE DETAILS THANK YOU FOR READING