7th Mar 2025 · SEBI-Registered Analyst
Investment Insights with Adarsh · 7th Mar 2025
Rising Wedge Pattern: PART 1
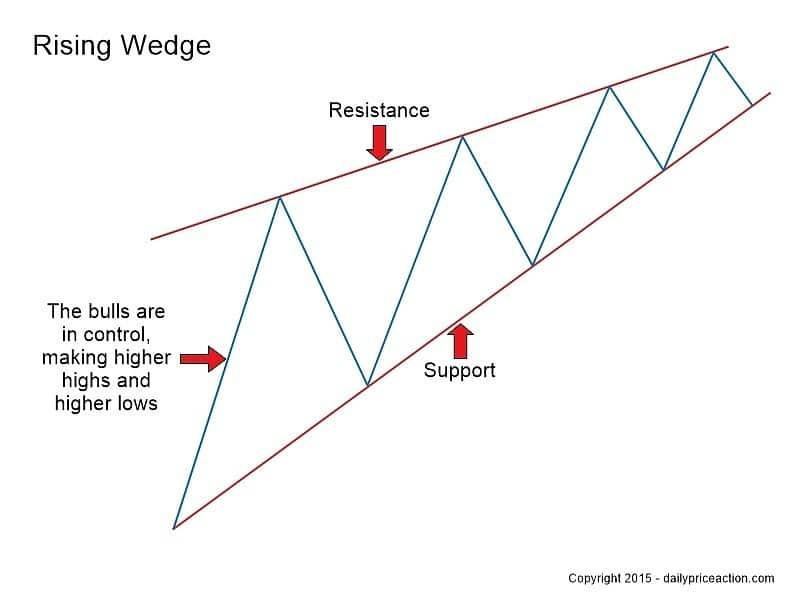
1. What is a Rising Wedge? A Rising Wedge is a chart pattern characterized by two trendlines that converge, with both the highs and lows moving upwards but at an ever-decreasing rate. The pattern suggests that the price is increasingly being squeezed between the trendlines, and as the distance between the support and resistance narrows, it becomes more likely that a breakout will occur, signaling a potential reversal. • Shape: The wedge has a slanted shape that moves upwards, but the trendlines form at a smaller angle as they converge. • Direction: A rising wedge typically forms during an uptrend and signals a potential reversal to the downside. It can also occur after a period of consolidation in a market. 2. Key Characteristics of the Rising Wedge • Trendlines: The rising wedge is bounded by two slanting trendlines: o Upper Trendline (Resistance): Connecting the highs of the price action, which are progressively higher. o Lower Trendline (Support): Connecting the lows of the price action, which are also moving upward, but at a steeper angle than the highs. • Convergence: Both the resistance and support trendlines converge as the pattern progresses, indicating a tightening range. • Volume: Volume typically decreases as the wedge forms, signaling that the market is losing momentum. A breakout or breakdown is confirmed with a sharp increase in volume. • Duration: The rising wedge can form over a short to medium-term period. The longer the wedge forms, the more significant the breakout could be. DUE TO LIMITED WORDDINGS AND TO NOT GET BORED I HAVE DIVIDED IT IN 3 PARTS 1. INTRO 2. HOW TO TRADE 3. PROS AND CONS READ ALL FOR GOOD KNOWLEDGE IN THE TOPIC