23rd Mar 2025 · SEBI-Registered Analyst
Investment Insights with Adarsh · 23rd Mar 2025
RSI AND MACD: UNDERSTANDING MOMENTUM INDICATORS (PART 1)
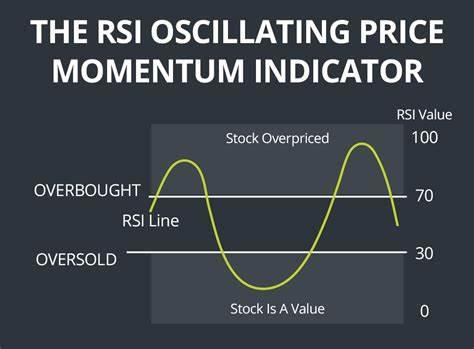
RSI (Relative Strength Index) and MACD (Moving Average Convergence Divergence) are two popular momentum indicators used in technical analysis to help traders assess the strength and direction of a trend, as well as identify potential reversal points in the market. Both indicators focus on momentum—the speed at which prices move in a certain direction—and help traders identify whether an asset is overbought or oversold or if a trend is weakening or strengthening. 1. Relative Strength Index (RSI): Overview: • RSI is a momentum oscillator that measures the speed and change of price movements. It is typically used to identify overbought and oversold conditions, helping traders spot potential reversal points in the market. • Developed by: J. Welles Wilder in 1978. • Range: RSI ranges from 0 to 100. How RSI Works: • The formula compares the average gains to the average losses over a specified period (usually 14 periods). o RSI Calculation involves the following steps: 1. Average Gain = (Sum of all up periods’ gains) / 14. 2. Average Loss = (Sum of all down periods’ losses) / 14. 3. RSI is then plotted, with values typically moving between 0 and 100. Key Levels: • Overbought (RSI > 70): When RSI is above 70, it suggests the asset might be overbought (i.e., too much buying pressure) and could be due for a price pullback or trend reversal. • Oversold (RSI < 30): When RSI is below 30, it indicates the asset might be oversold (i.e., too much selling pressure), and a bullish reversal could be on the horizon. READ PART 2 FOR MORE INFORMATION