22nd May 2025 · SEBI-Registered Analyst
Investment Insights with Adarsh · 22nd May 2025
RSI Divergence Technique Report
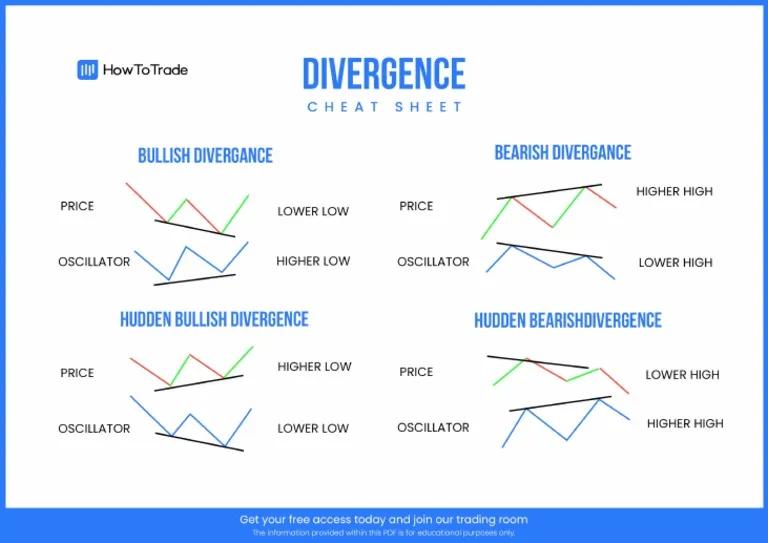
Introduction to RSI The Relative Strength Index (RSI) is a momentum oscillator developed by J. Welles Wilder. It ranges from 0 to 100 and is typically used to identify overbought (above 70) or oversold (below 30) conditions. However, beyond overbought/oversold levels, RSI divergence provides a powerful signal of potential trend reversals. What is RSI Divergence? RSI divergence occurs when the price and the RSI indicator move in opposite directions. This signals a weakening trend and a possible reversal. Two Types of Divergence: 1. Bullish Divergence Occurs when: • Price makes a lower low • RSI makes a higher low Indicates: Downtrend is weakening. A reversal to the upside may occur. Use case: Often appears before a rally in downtrending stocks or indices. Confirmation: Can be confirmed with price action (e.g., bullish engulfing candle) or support levels. 2. Bearish Divergence Occurs when: • Price makes a higher high • RSI makes a lower high Indicates: Uptrend is losing strength. A reversal to the downside may follow. Use case: Useful in identifying potential top formations or exit points in long trades. Confirmation: Strengthened if divergence occurs near a resistance zone or with volume dropping. Strategy Application Entry Rules • Bullish: Enter long after price forms a bullish candlestick near support post-divergence. • Bearish: Enter short after bearish candle near resistance confirms divergence. Exit/Target • Use recent swing highs/lows or Fibonacci levels. • RSI crossing the midline (50) can signal trend strength. Stop-loss • Below the divergence low (for bullish) or above divergence high (for bearish). Conclusion The RSI Divergence technique is a reliable tool for spotting momentum shifts before price reacts. When used with supporting confirmation methods like volume or candlestick signals, it becomes a powerful component in a trader’s strategy arsenal.