8th May 2025 · SEBI-Registered Analyst
Investment Insights with Adarsh · 8th May 2025
Sharpe Ratio – Measuring Risk-Adjusted Returns
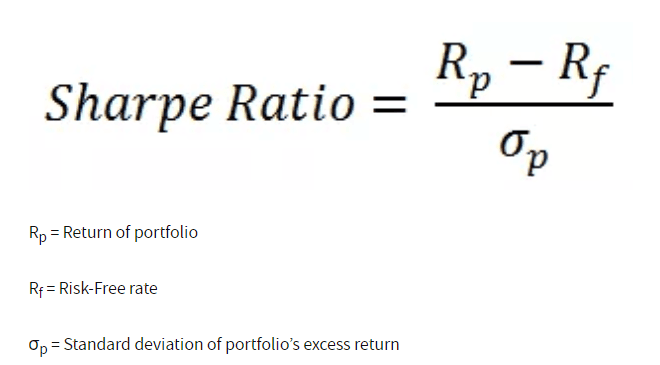
The Sharpe Ratio is a popular tool in portfolio management that helps investors understand how much return they’re getting per unit of risk taken. It adjusts performance for the risk involved and helps compare different investments on a level playing field. Formula Sharpe Ratio = (Rp − Rf) / σp • Rp = Portfolio return • Rf = Risk-free rate (e.g., government bond yield) • σp = Standard deviation (volatility) of portfolio returns Interpretation • Sharpe Ratio > 1: Good risk-adjusted return • Sharpe Ratio > 2: Very good • Sharpe Ratio < 1: Not efficient – you may be taking too much risk for too little return Why It Matters 1. Comparison Across Portfolios: You can compare mutual funds, stocks, or strategies with different volatilities. 2. Helps Eliminate “High Return, High Risk” Bias: A portfolio giving high returns might not be worth it if it’s too volatile. 3. Risk Efficiency: Indicates whether the extra risk is paying off or not. Example Suppose: • Portfolio return = 12% • Risk-free return = 5% • Volatility = 10% Sharpe = (12 - 5) / 10 = 0.7 This implies poor risk-adjusted return – you might want to reassess the strategy. Limitations • Uses standard deviation which treats upside and downside volatility the same. • Assumes returns are normally distributed, which may not always be true. • Not ideal for portfolios with asymmetric or skewed returns (e.g., options strategies). Final Insight The Sharpe Ratio is critical for comparing investment strategies fairly, especially when risk levels differ. It’s widely used in fund analysis, especially for mutual funds, PMS, and AIFs.