7th May 2025 · SEBI-Registered Analyst
Investment Insights with Adarsh · 7th May 2025
Treynor Ratio: Measuring Return Per Unit of Market Risk
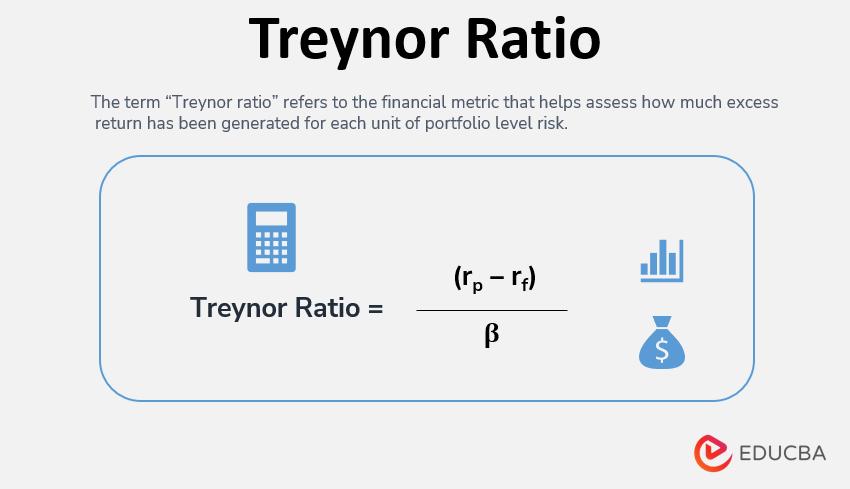
The Treynor Ratio is a performance metric that, like the Sharpe Ratio, assesses risk-adjusted returns—but with a key difference. Instead of total volatility, it considers only systematic risk, or market-related risk, measured by beta. Formula Treynor Ratio = (Portfolio Return – Risk-Free Rate) / Beta • Portfolio Return: Average return of the investment. • Risk-Free Rate: Return from a risk-free asset (e.g., government bonds). • Beta: Measures how sensitive the investment is to overall market movements. Key Difference from Sharpe and Sortino • Sharpe Ratio: Uses total volatility (standard deviation). • Sortino Ratio: Uses downside risk. • Treynor Ratio: Uses only systematic risk (beta), assuming unsystematic risk is diversified away. Use Case 1. Well-Diversified Portfolios: The Treynor Ratio is meaningful only when portfolios are already diversified (thus eliminating unsystematic risk). 2. Fund Manager Comparison: Helps evaluate how well a fund manager has compensated investors for market risk taken. Example Let’s say a mutual fund earned a 12% return, the risk-free rate is 6%, and the portfolio has a beta of 1.2. Treynor Ratio = (12 – 6) / 1.2 = 5.0 A higher Treynor Ratio means better risk-adjusted performance, relative to market movements. Limitations • Not for Undiversified Portfolios: Since it ignores unsystematic risk, it may mislead for concentrated portfolios. • Beta Fluctuation: Beta changes over time, especially in volatile markets. Final Thought The Treynor Ratio is ideal when evaluating how much excess return a manager delivers per unit of market risk. It’s a cleaner metric than Sharpe for institutional investors focused solely on systematic risk.