21st Mar 2025 · SEBI-Registered Analyst
Investment Insights with Adarsh · 21st Mar 2025
VOLUME ANALYSIS: HOW TO READ MARKET STRENGTH (PART 2)
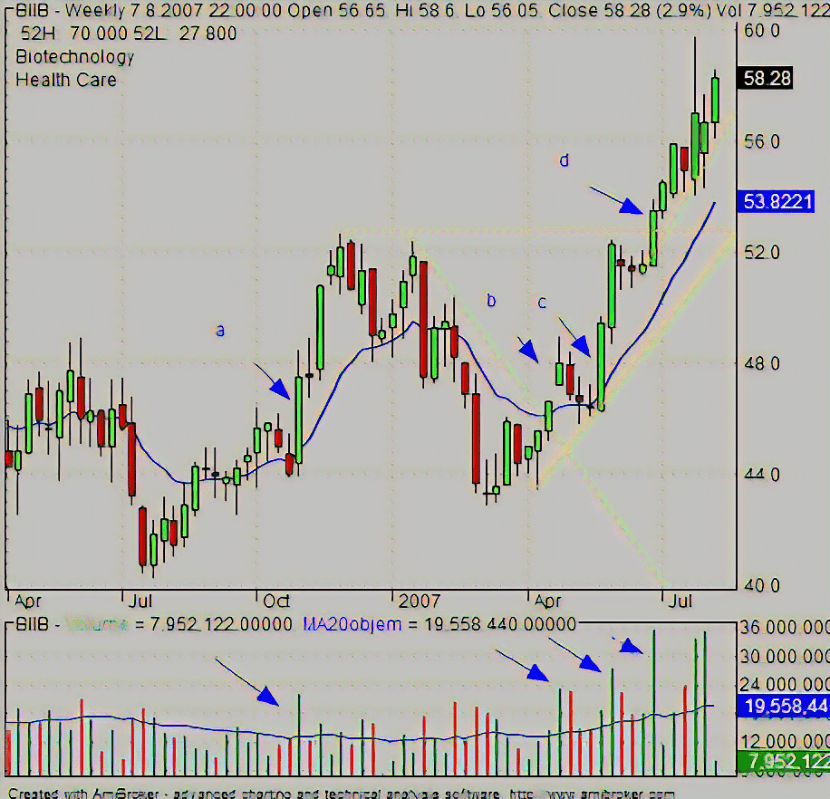
2. Volume at Key Support and Resistance Levels Volume is particularly useful in confirming the strength of support and resistance levels. • High Volume at Support: If the price reaches a support level and volume spikes, it indicates that many buyers are entering the market, showing a strong buying interest and likely signaling a bounce. • High Volume at Resistance: If price reaches a resistance level with high volume, it suggests that there is strong selling pressure at this level, and the price may struggle to break higher. If the resistance is breached on high volume, it indicates strong buying interest and the potential for further upward movement. • Low Volume at Support or Resistance: If price reaches a support or resistance level with low volume, it suggests weak market participation and that the price level might not hold. A break of support or resistance may not have significant momentum behind it, indicating potential for a false breakout or breakdown. 3. Volume-Based Patterns and Indicators Volume analysis can be used in conjunction with chart patterns and technical indicators to predict future price movement. Volume Spike: • A volume spike indicates an increase in market activity and can often precede a sharp price move. It is especially significant when it happens during price consolidations, suggesting a breakout or breakdown is imminent. Accumulation and Distribution: • Accumulation refers to the process of buying that takes place as the price is rising or staying within a range. High volume during periods of accumulation suggests that investors are building positions in anticipation of future price increases. • Distribution is when large players begin to sell as prices rise. High volume during distribution shows that smart money is exiting, and prices may soon fall. read more Information in next part