


ITC Technical Analysis
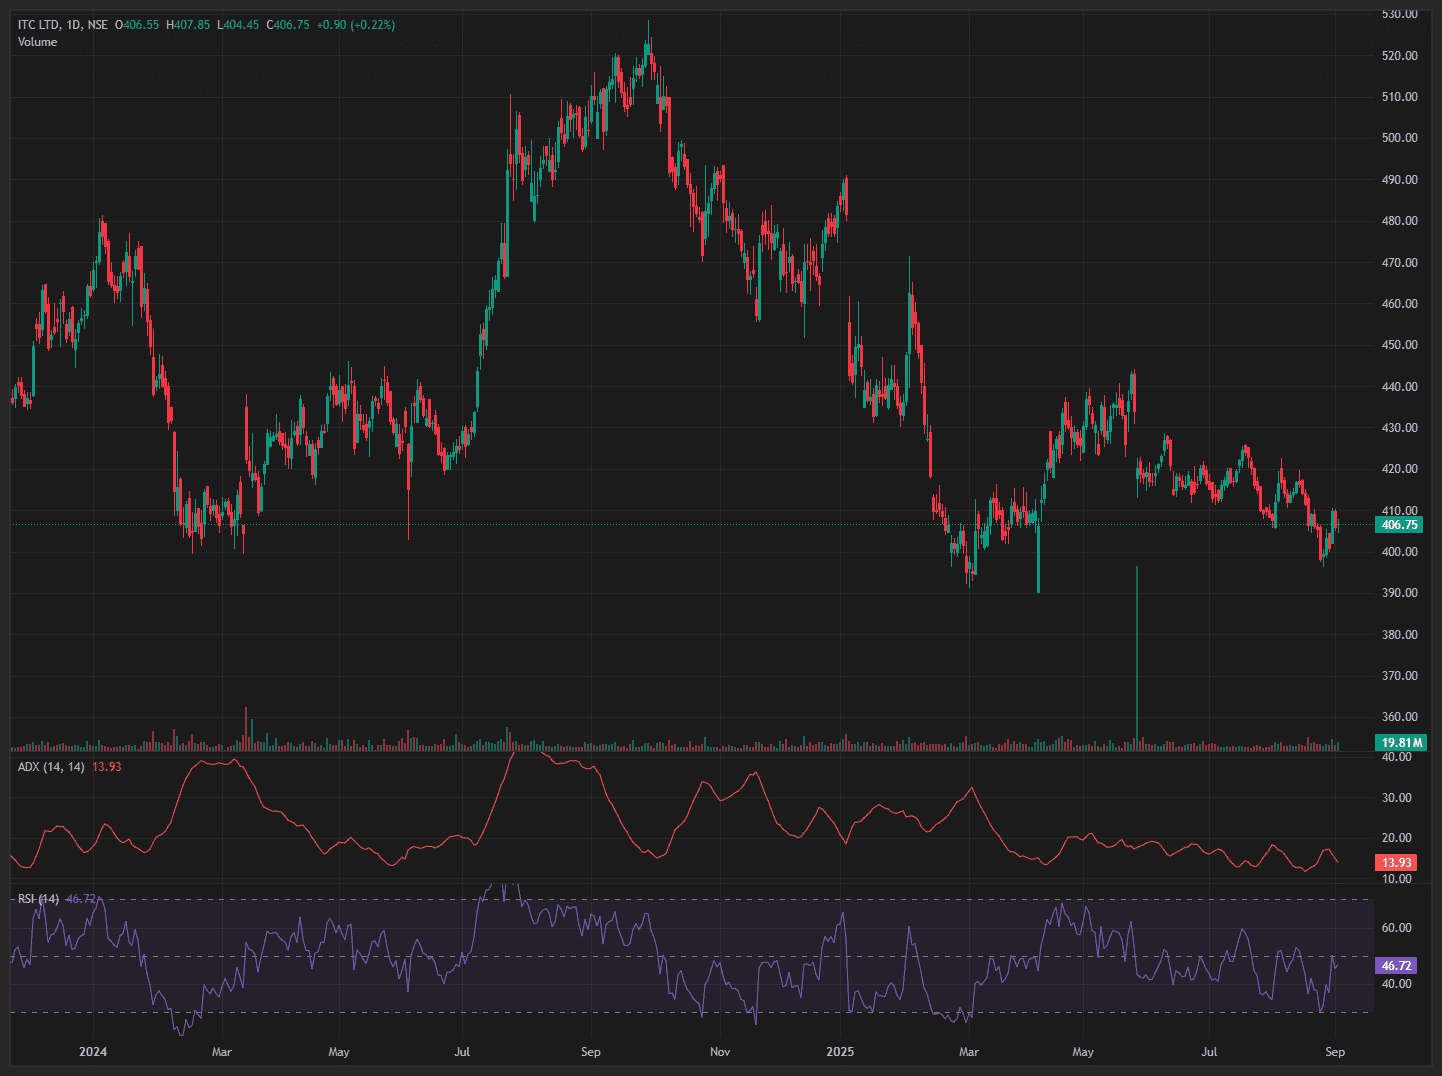
The chart of ITC shows that the stock has been in a downtrend since its peak near ₹520, consistently making lower highs and lower lows. Currently, it is trading around ₹406, consolidating after a recent decline. The ADX (13.93) indicates a weak trend strength, suggesting sideways or range-bound movement. The RSI (46.72) is neutral, neither overbought nor oversold, reflecting indecision in momentum. Overall, the stock is lacking strong bullish signals and may continue consolidating unless it breaks decisively above resistance (₹420) or below support (₹390).
#TechnicalViews
766 likes·60 comments