


LTF Technical Analysis with Price Action
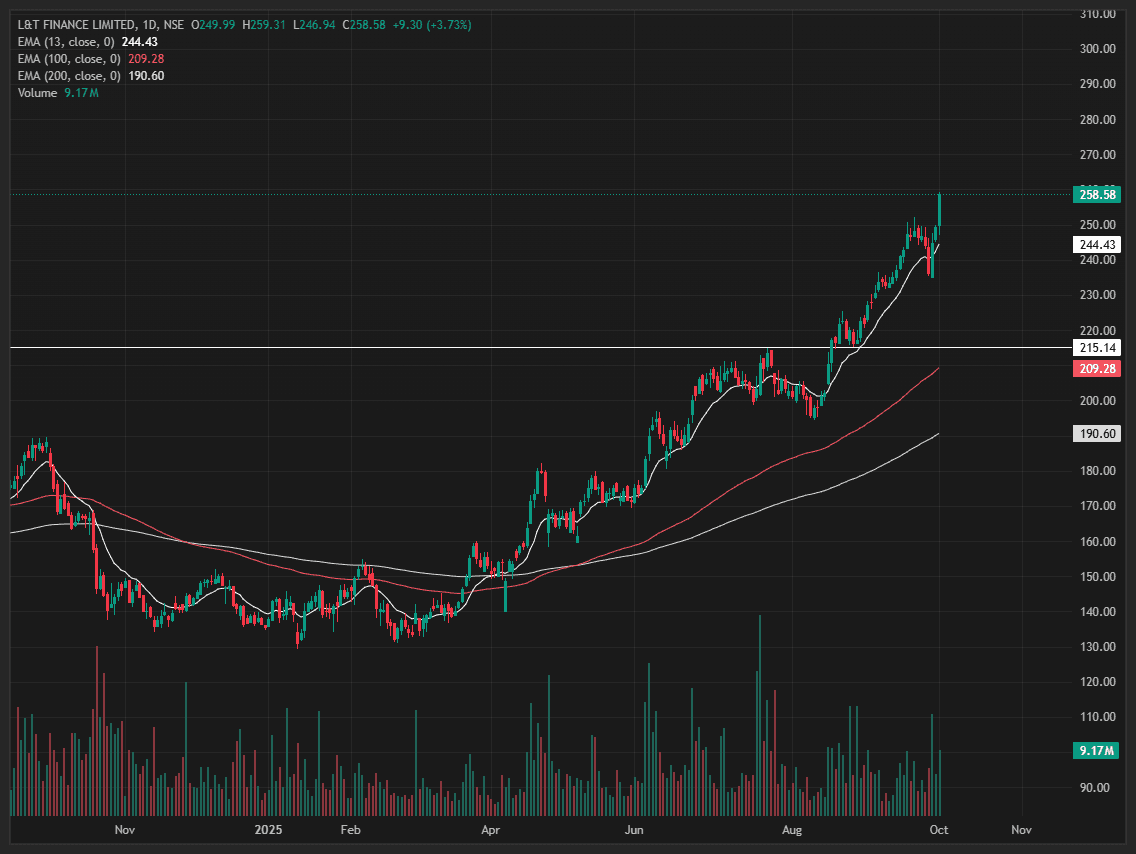
LTF has exhibited strong bullish price action, especially over the last few months, as seen on the daily chart. After a prolonged consolidation and sideways movement through late 2024 and early 2025, the stock began an uptrend around April 2025, breaking past resistance levels with increased momentum. It is now trading at 258.58, significantly above key moving averages: EMA 13 at 244.43, EMA 100 at 209.28, and EMA 200 at 190.60, all indicating strong underlying trend strength. The recent price breakout was backed by a surge in volume, suggesting robust buying interest and confirmation of the ongoing uptrend.
#TechnicalViews
751 likes·52 comments