


27th Sep 2025 · SEBI Registration INA100014055
SEBI Registration INA100014055 · 27th Sep 2025
PHOENIXLTD Technical Analysis
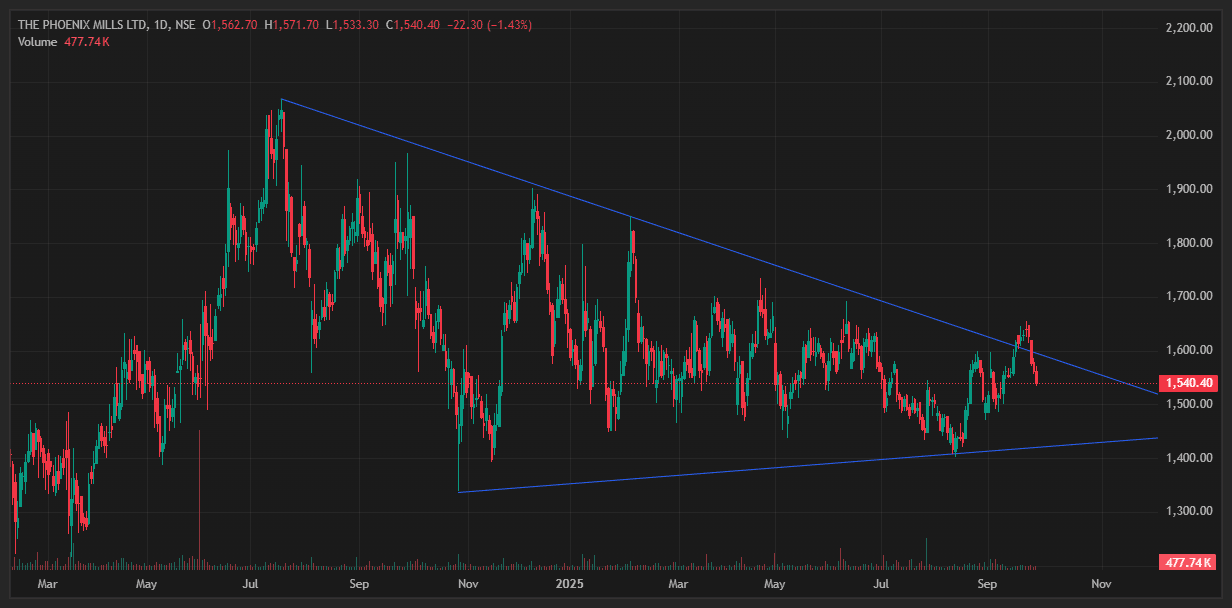
PHOENIXLTD is trading inside a large symmetrical triangle, showing indecision between buyers and sellers. The stock recently tried to break out above 1600 but failed to sustain and slipped back inside the pattern. Currently, it is hovering near 1540, which is close to the middle range of the triangle. A breakout above 1620–1650 with volume may trigger an upside move towards 1750–1850, while a breakdown below 1480–1500 could drag the price towards 1400–1360. Traders should wait for a clear breakout before taking any position.
#TechnicalViews
910 likes·69 comments