


Technical Analysis on PNB
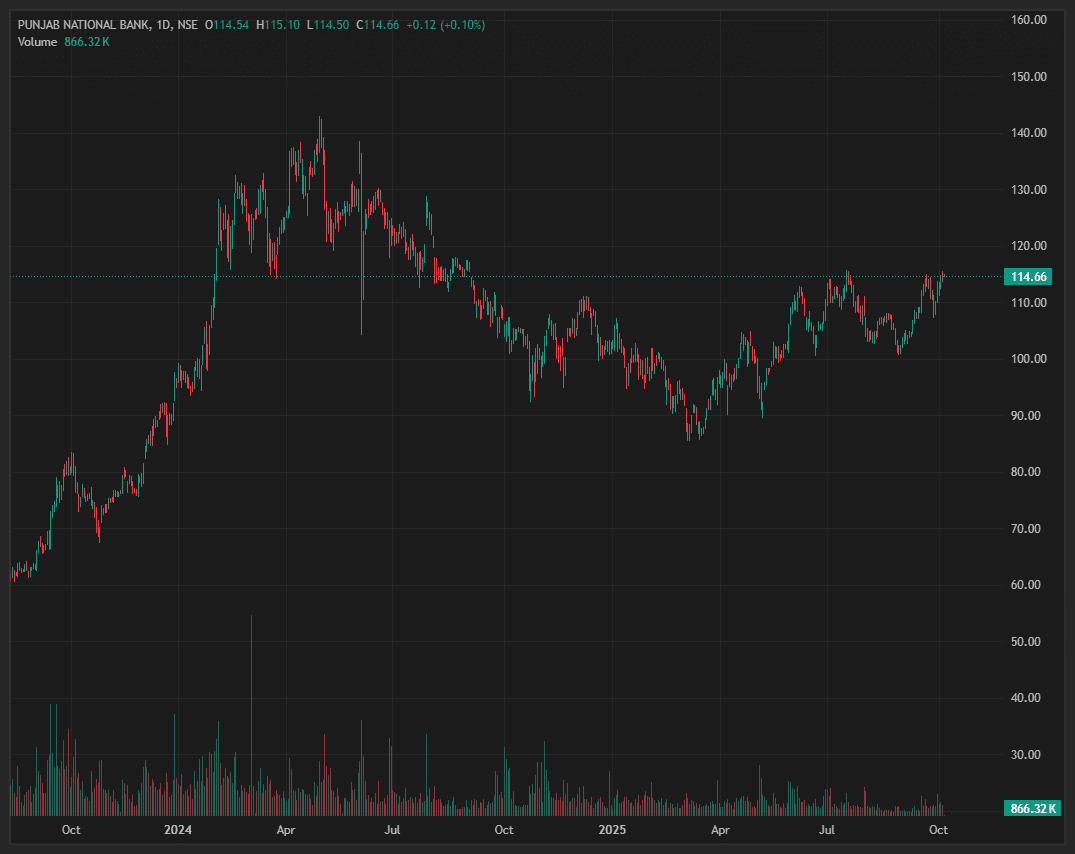
The chart of PNB on the daily timeframe shows a strong uptrend from mid-2023 to early 2024, followed by a sharp correction and consolidation phase through 2025. Price action indicates that after forming a major top near ₹150, PNB retraced to the ₹85–90 zone, which acted as a solid support base. Since then, the stock has been forming higher lows, showing accumulation and strength recovery. Currently, it’s approaching a key resistance zone around ₹115–120 — a breakout above this level, backed by volume, could trigger a trend continuation toward ₹130–135. However, failure to sustain above ₹120 may lead to short-term consolidation near ₹105. Overall, the structure suggests a bullish bias with momentum building for a potential breakout.
#TechnicalViews
669 likes·69 comments