18th Jun 2025 · SEBI-Registered Analyst
Real Value Investing with Arpit Goel · 18th Jun 2025
TRENT Technical Analysis
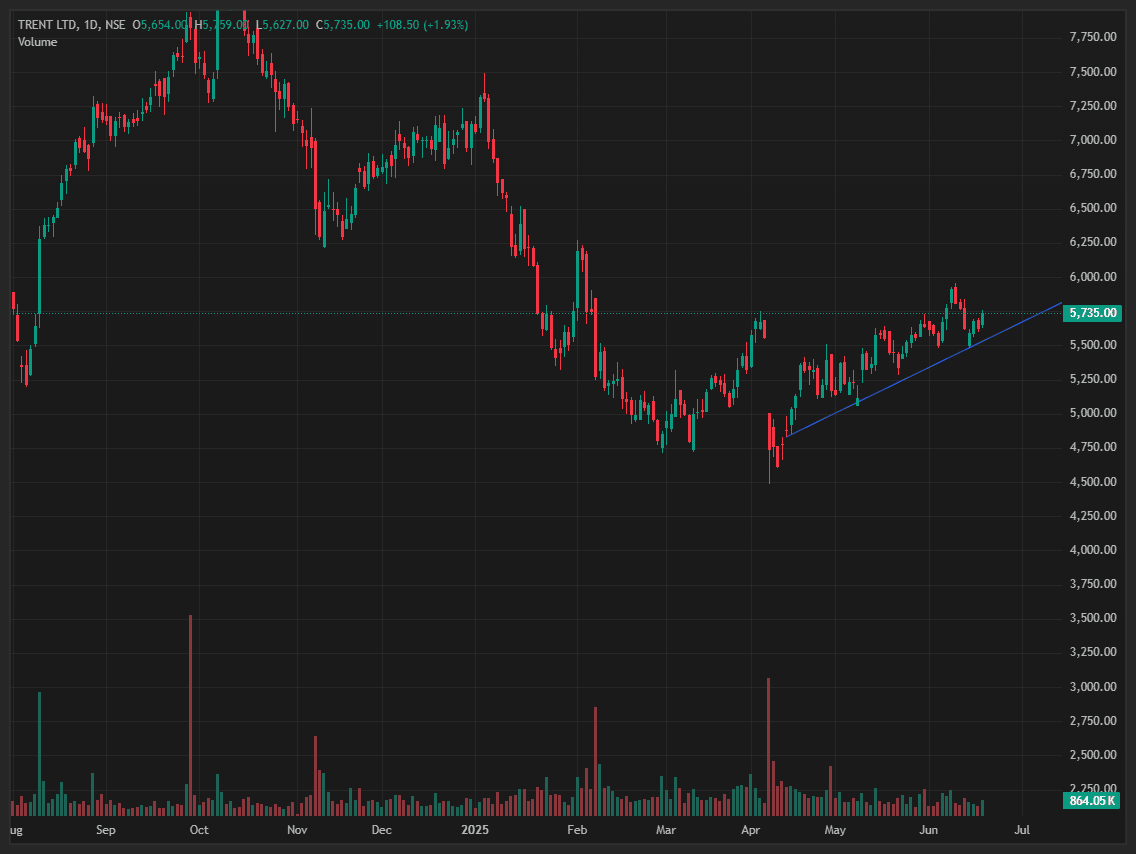
The chart of TRENT (daily timeframe) shows a clear ascending triangle pattern forming since late March 2025, with consistent higher lows and horizontal resistance around the ₹5,750–₹5,800 zone. The price recently bounced off the ascending trendline, indicating ongoing bullish momentum. A breakout above ₹5,800 with strong volume could trigger a fresh upside rally, while failure to hold the trendline (~₹5,500) may invite short-term selling pressure. Momentum remains positive, and the pattern suggests accumulation ahead of a potential breakout.
#TechnicalViews