


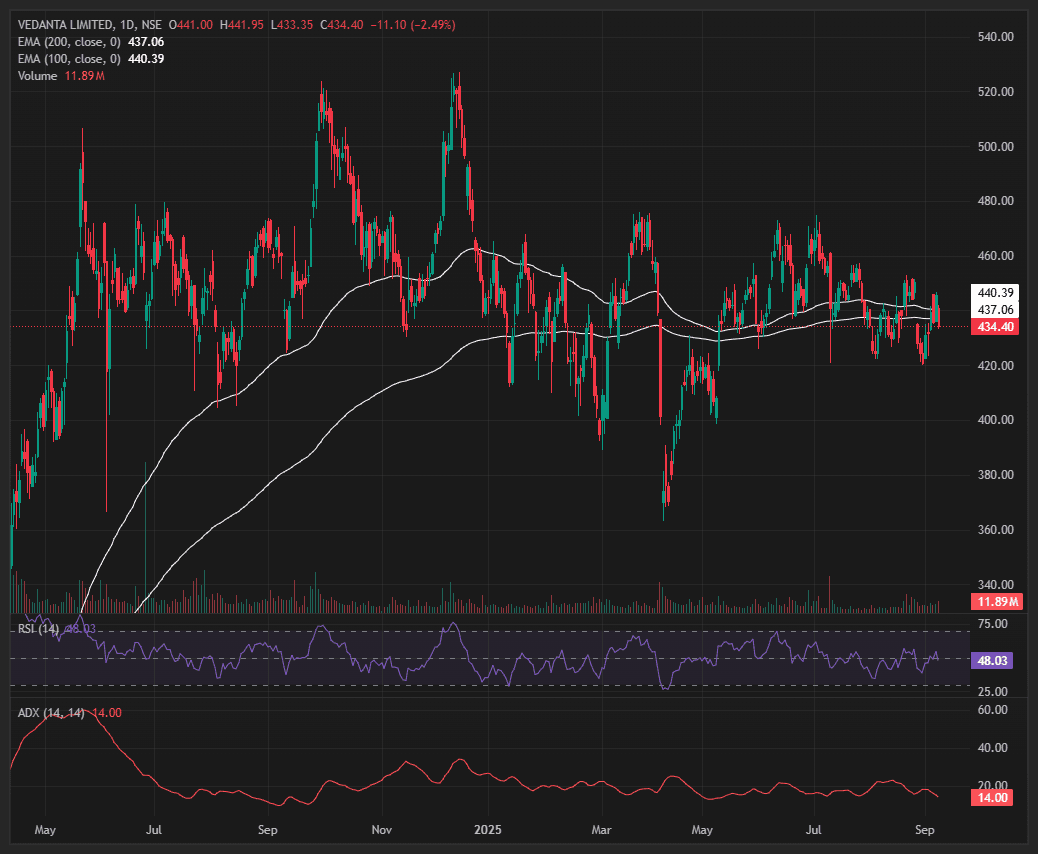
VEDL Chart is looking Weak in its range****
VEDL is showing range-bound price action with repeated rejections near 460–470 and support emerging around 420 levels; currently, the stock has slipped below the 100-day EMA (440) and is hovering close to the 200-day EMA (437), signaling weakness as sellers are pressuring below key moving averages. The broader structure indicates consolidation with a slightly bearish bias, as lower highs have formed since July while support zones are being retested more frequently, suggesting that a breakdown below 420 could accelerate downside, whereas a decisive close above 460 is needed to revive bullish momentum.
#TechnicalViews
536 likes·84 comments