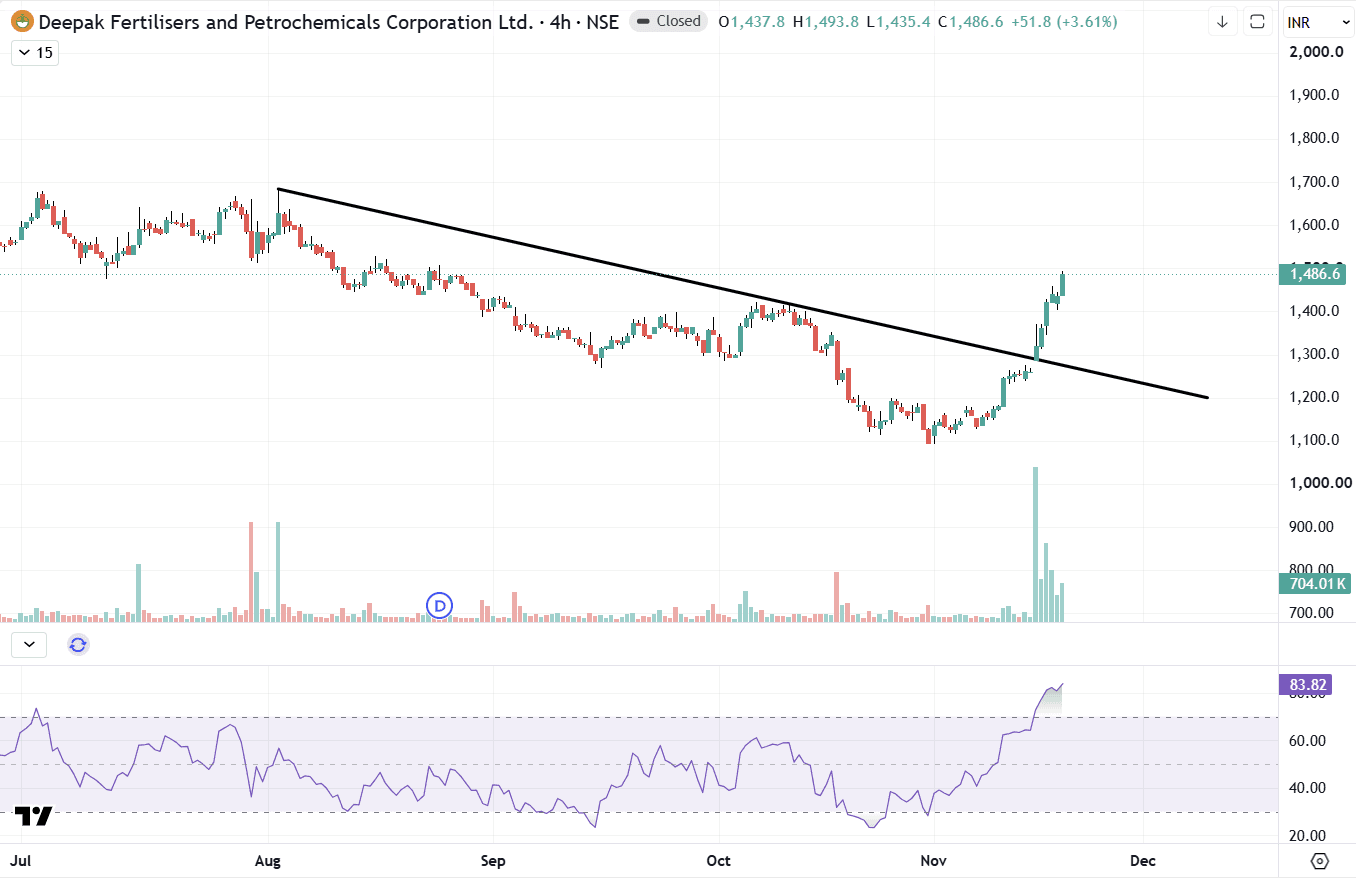
Deepak Fertilisers Update: Breakout Extends
In yesterday’s post we had highlighted DEEPAKFERT moving above the falling trendline that capped the stock from the August high. Since then the move has extended on the 4-hour chart, and the stock is now near 1,487, about 3% higher than yesterday’s level around 1,440. It has also moved about 15% above the 1,290-1,300 breakout zone, which remains the first support to watch. The latest 4-hour candle reached a high near 1,494, and the sequence of higher highs and higher lows since the October low is intact. After such a sharp advance, some consolidation or a retest of the broken trendline would not be unusual. The 1,520 area is the nearest reference above, followed by the August high near 1,680. Whether the stock holds above the trendline zone is worth observing, and a close back below it would weaken the setup. Volume and RSI were not shown on this chart, so confirmation from volumes would add weight to the move. After a trendline breakout, the broken line often becomes support; tracking it as the stock extends helps judge whether the move is holding. Disclaimer: This is for educational purposes only and is not investment advice. Please consult your financial advisor before making any investment decisions. SEBI Registered Research Analyst — INH000025212.