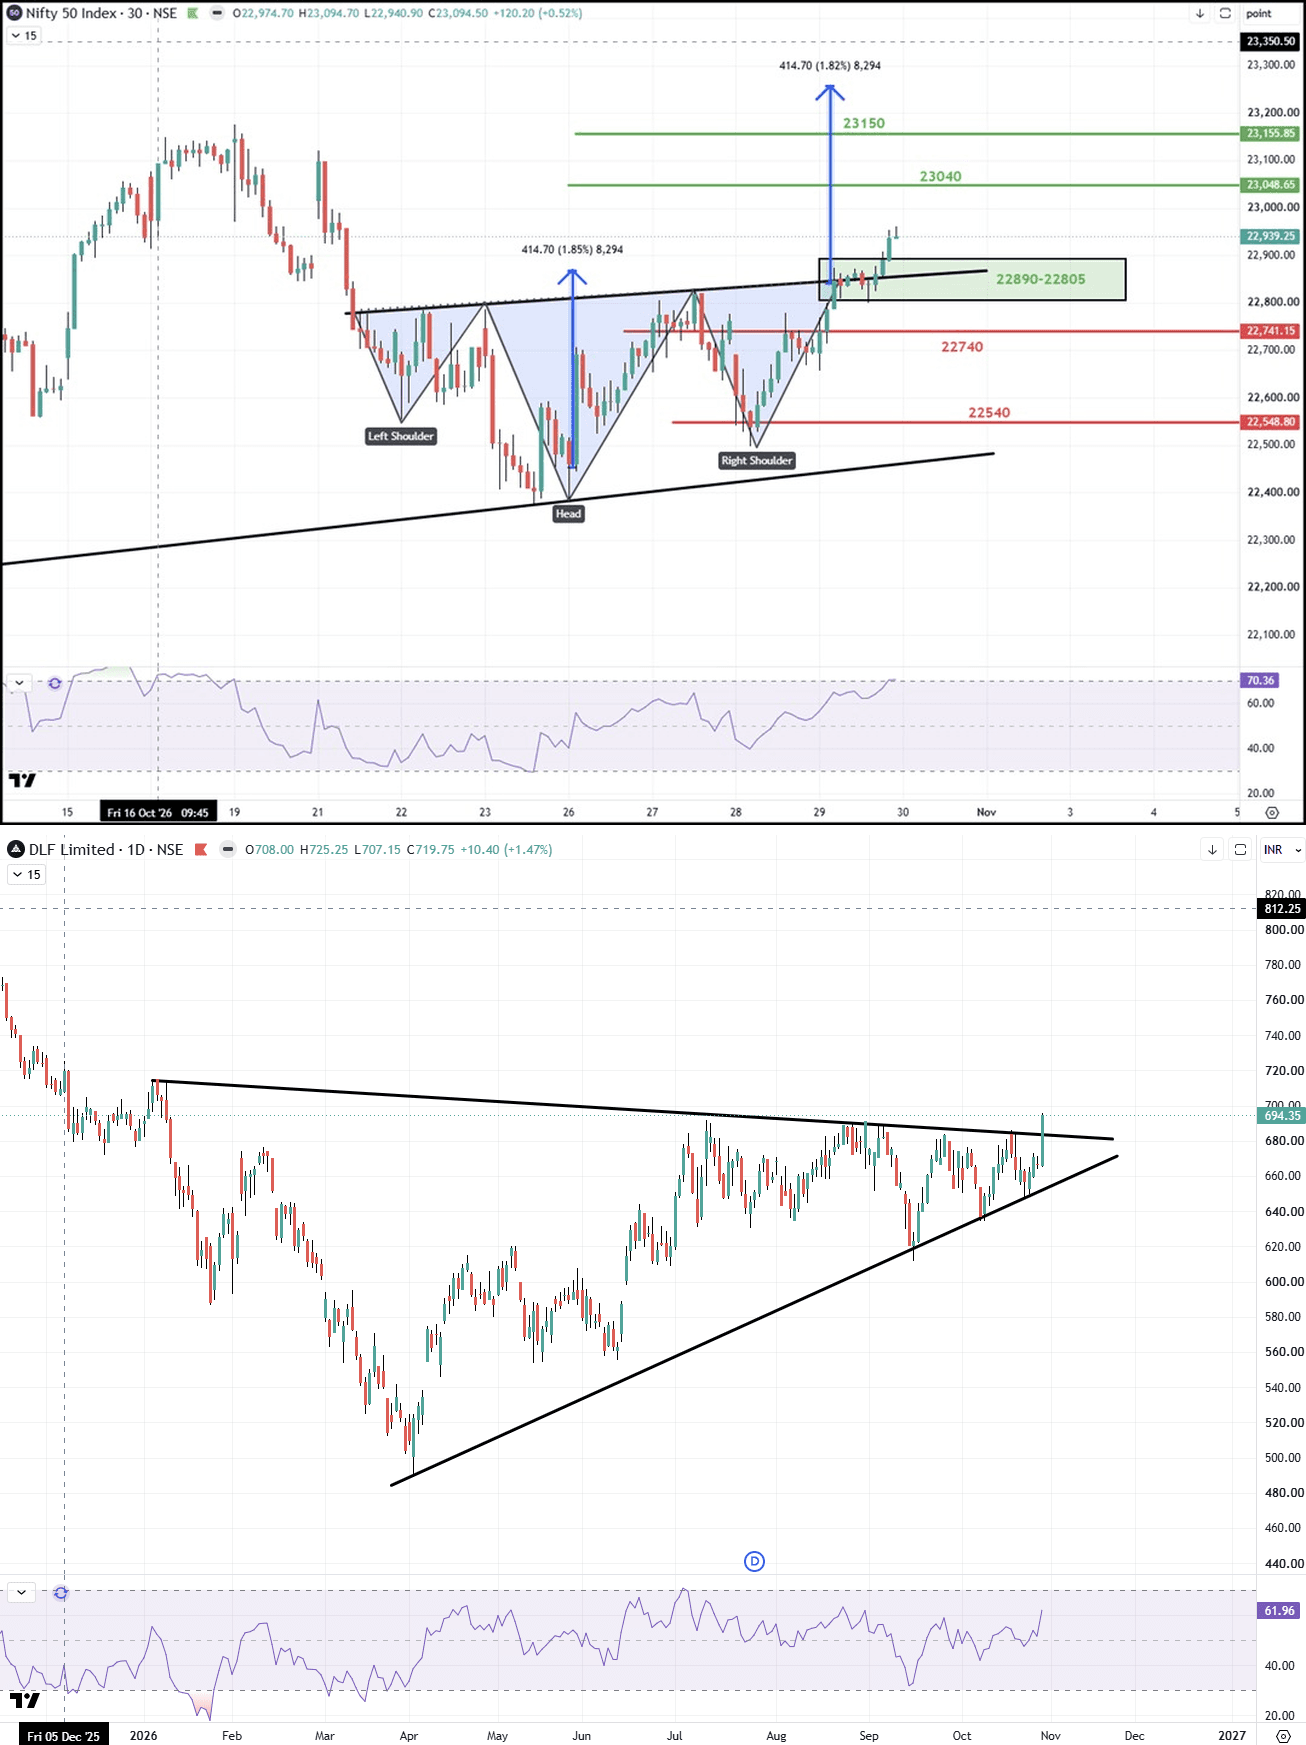
Nifty Inverse H&S in Play; DLF Breaks Out
Nifty extended its move yesterday and closed near the 23,000 mark after a small inverse Head & Shoulders breakout. The larger pattern has also been penetrated, with a measured-move reference around 23,200 and slightly above. RSI near 70 shows strong momentum but also leaves room for consolidation, and 22,890-22,805 is the pivot zone to watch. Against this backdrop, DLF is one stock in focus. On the daily chart it has been trading inside a symmetrical triangle through 2026, with a rising trendline from the April low and a falling upper trendline near 685. The stock has now moved above the upper bound with a strong green candle, trading around 694. RSI near 62 is improving without being overbought. The key question is whether the breakout sustains. A few daily close that holds above the broken trendline would add credibility, while a slip back inside the triangle would weaken the setup. Volume and follow-through over the coming sessions are worth observing. A symmetrical triangle breakout needs confirmation; holding above the broken trendline and rising volume help separate a genuine breakout from a false move. Disclaimer: This is for educational purposes only and is not investment advice. Please consult your financial advisor before making any investment decisions. SEBI Registered Research Analyst — INH000025212.