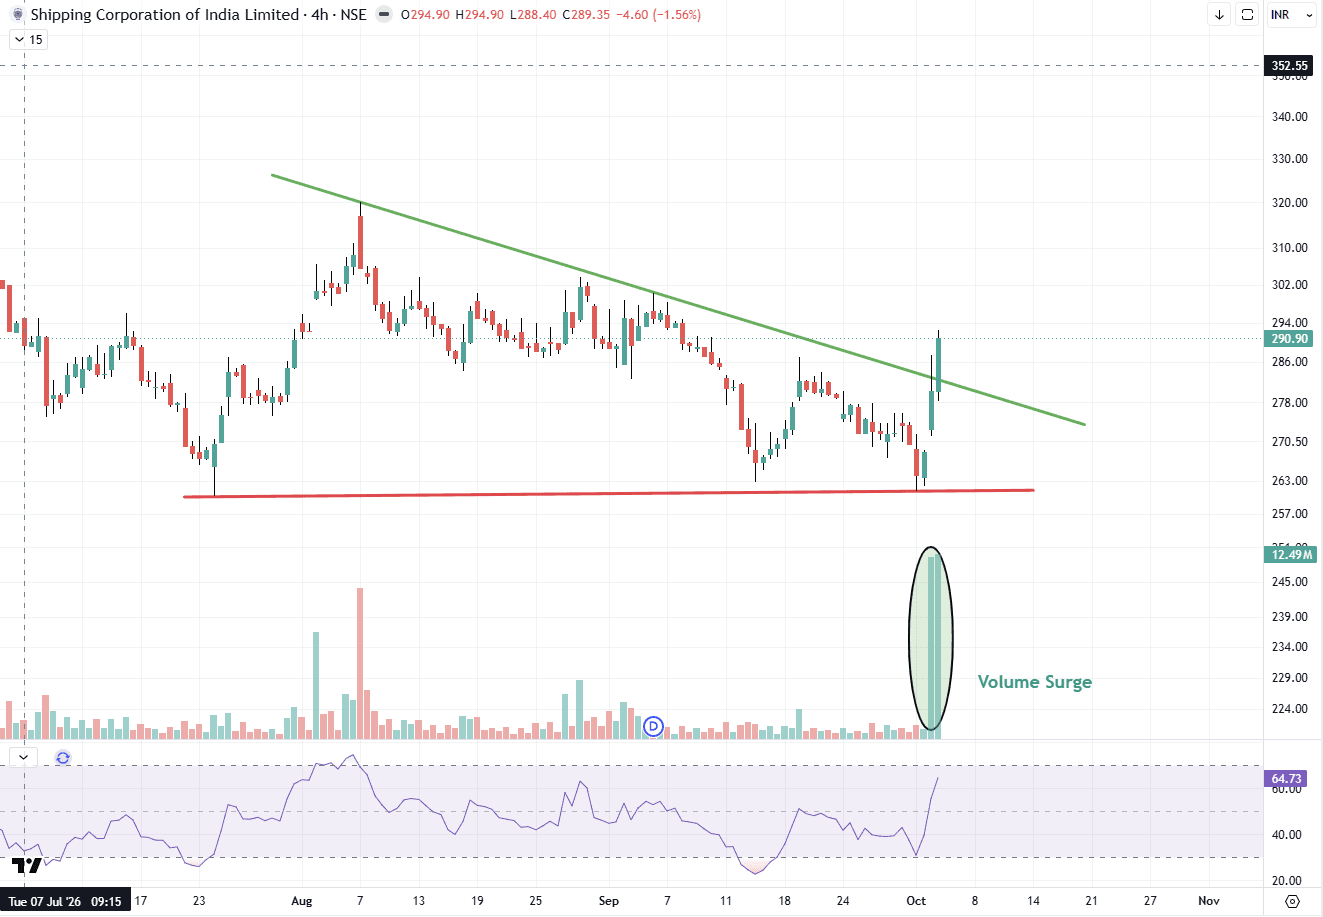
SCI Moves Past Falling Trendline on Volume Surge
SCI has moved above the descending trendline that had capped rallies since the early-August high near 320, closing the 4-hour session at 290.90, up 3.82%. The stock had been contracting inside a triangle-type structure, with lower highs pressing against a flat support base near 260-263, which was tested again in early October before the sharp rebound. The move came with a notable surge in volume, which adds weight to the price action. RSI has risen to 64.73 from the oversold zone in mid-September, in line with the bullish momentum shift visible on the chart. Resistance: 294, then 302-304 (September swing zone), and 320 (August high). Support: 282-286 (broken trendline zone), then 270-275, with 260-263 as the base of the structure. Whether the stock can confirm breakout on a closing basis in the coming sessions will help determine if this move extends or fades back into the earlier range. A return below 282 would put the breakout in question. A breakout from a contracting structure gains credibility when volume expands and momentum turns together, but holding above the broken line is what confirms it. Disclaimer: This is for educational purposes only and is not investment advice. Please consult your financial advisor before making any investment decisions. SEBI Registered Research Analyst — INH000025212.