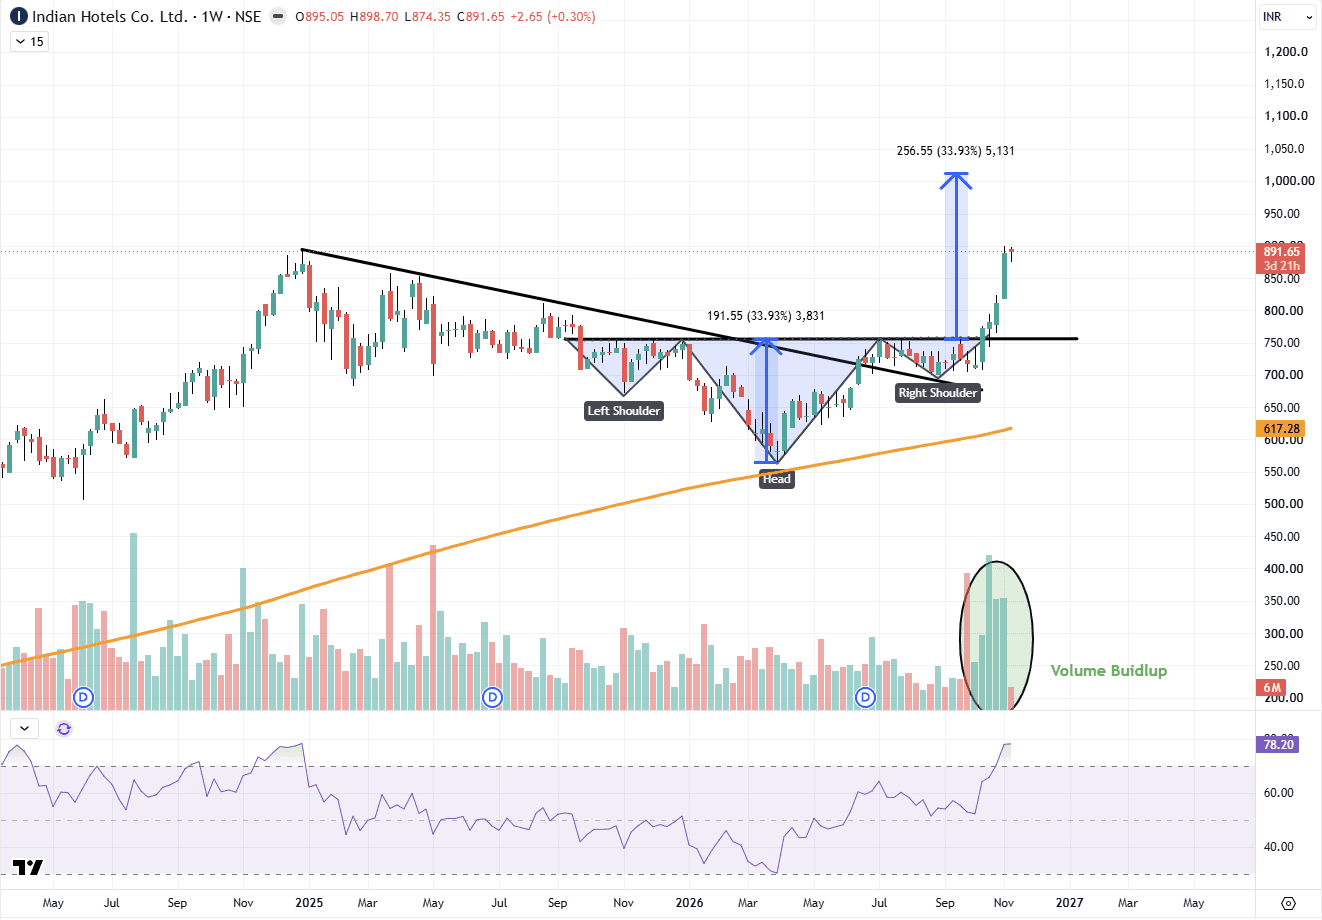
Why Patterns Matter: Indian Hotels Case Study
Chart patterns help traders read the psychology of buyers and sellers, and the INDHOTEL weekly chart is a good illustration. The stock built an inverse Head & Shoulders over many months, with a left shoulder, a deeper head and a higher right shoulder. This shows sellers losing strength with each push lower. At the same time, a falling trendline kept capping rallies until price finally moved above it. The neckline breakout then came with a visible buildup in volume, which matters because rising participation adds weight to a breakout. The pattern’s depth is also used as a measured-move reference, a guide to how far a move can extend. After a sharp advance, RSI had moved into the overbought zone, a reminder that strong momentum can also bring consolidation. Patterns are not guarantees. They work best when combined with volume, trend and momentum, and with a clear level where the idea is invalidated. Patterns show shifts in buyer-seller balance; confirmation through a neckline breakout, rising volume and a clear invalidation level makes them more reliable. Disclaimer: This is for educational purposes only and is not investment advice. Please consult your financial advisor before making any investment decisions. SEBI Registered Research Analyst — INH000025212.