‹ All Posts
ArthavrkshRA

23rd Aug · SEBI-Registered Analyst

Chart School: Hammer Candlestick- Rules and Significance

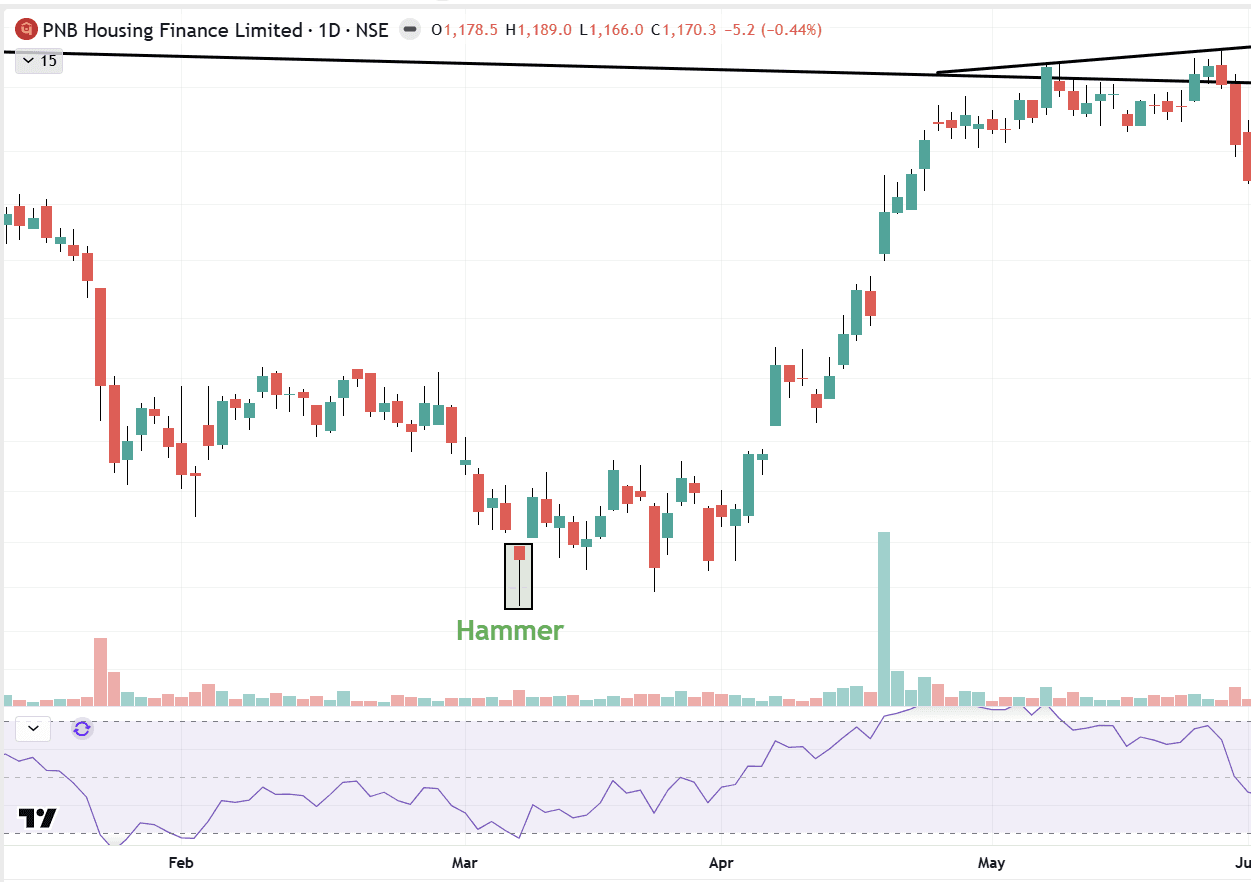
A Hammer is one of the most recognized single-candle reversal patterns, and PNB Housing Finance's chart from March offers a clean textbook example worth studying. What defines a Hammer: a small real body near the top of the candle's range, a long lower wick at least twice the length of the body, and little to no upper wick. It typically forms after a decline, showing that sellers pushed price sharply lower during the session, but buyers stepped in forcefully enough to drag price back up near the open, rejecting the lower levels. On the
PNBHOUSING
chart, this exact pattern appeared near the March lows around 1,000–1,050, after a multi-week decline from the January highs. The stock went on to rally sharply from that zone through April and May, eventually testing new highs — a useful real-world illustration of what a confirmed Hammer can lead to. The key rule often missed: a Hammer alone is not a buy signal. It needs confirmation, typically a bullish candle closing above the Hammer's high on the next session, alongside supportive volume. Acting on the Hammer before this confirmation is one of the more common mistakes traders make with this pattern. A Hammer signals seller exhaustion and a potential shift in control to buyers, but its reliability comes from confirmation on the following session, not from the single candle in isolation. Disclaimer: For educational purposes only, not investment advice. Please do your own due diligence or consult your advisor before investing. SEBI Research Analyst Registration No. INH000025212

#TechnicalViews#EquityResearch#Miscellaneous
PNB Hammer.png
616 likes