‹ All Posts
ArthavrkshRA

35 mins ago · SEBI Registration INH000025212

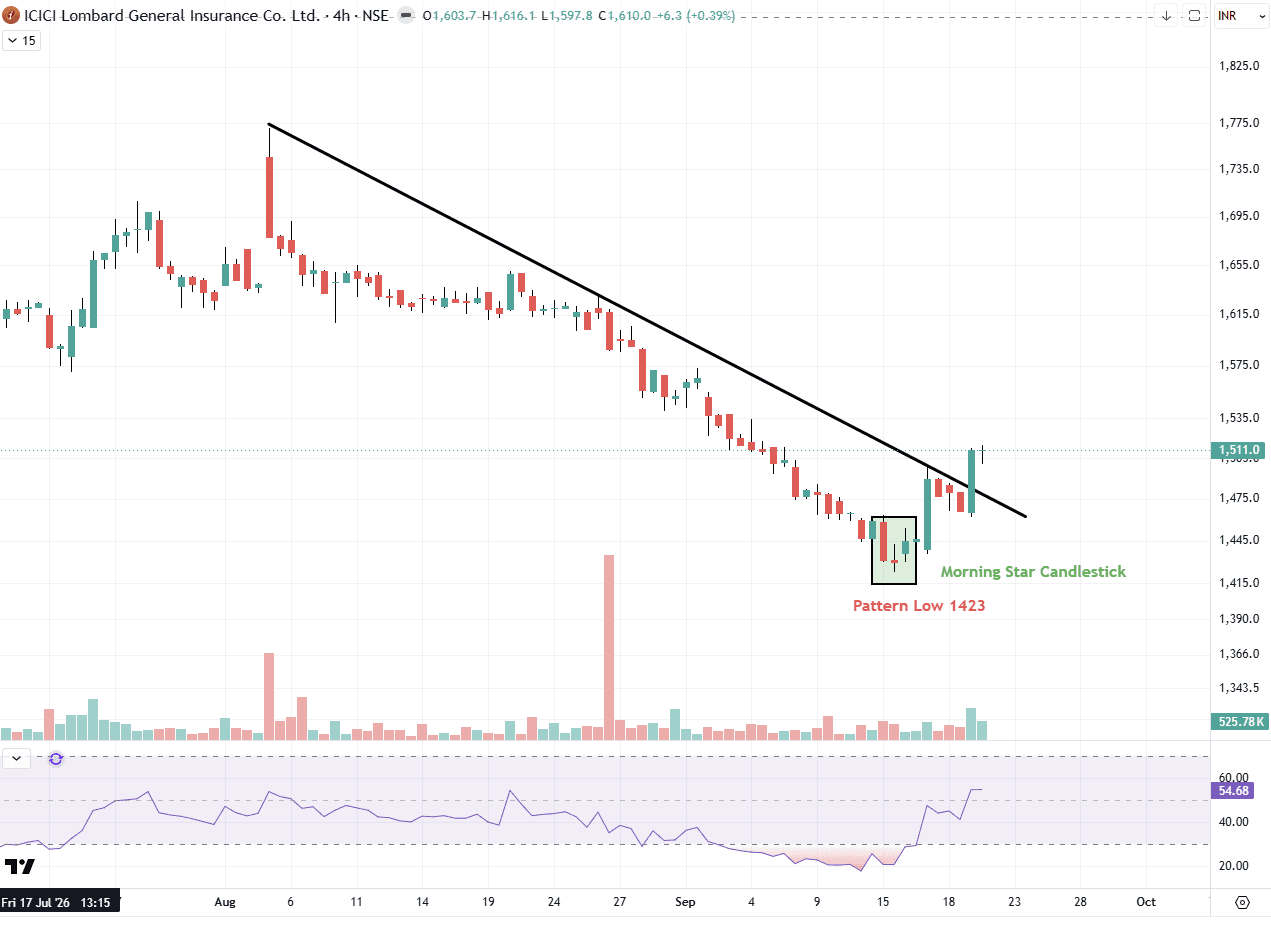
ICICI Lombard: Morning Star Meets Trendline Break
ICICIGI
has formed a Morning Star candlestick pattern near the 1,423 pattern low, with price subsequently moving above the falling trendline that had capped the stock since early August. The stock is trading near 1,511, with RSI at 54.68 turning up from the mid-range, both consistent with the early signs of a recovery attempt. The recovery has also been accompanied by a visible pickup in volume on the up candles following the pattern low, adding some weight to the reversal attempt rather than it being a low-participation bounce. Resistance: 1,550, then 1,590-1,630. Support: 1,480-1,490, then the 1,423 pattern low. A Morning Star formation combined with a trendline breakout and supporting volume is a combination often read as constructive, though the pattern's validity still rests on the 1,423 low continuing to hold. As long as that level isn't breached, the setup keeps a bullish edge; a slip back below it, especially without volume support, would call the reversal read into question. A reversal candlestick pattern gains more weight when it coincides with a trendline break, but the pattern's low remains the reference point that determines if the setup still holds. Disclaimer: This is for educational purposes only and is not investment advice. Please consult your financial advisor before making any investment decisions. SEBI Registered Research Analyst — INH000025212.

#WatchOutFor#TechnicalViews#Post-ClosingCommentary#EquityResearch
20092026 ICICIG.png
6 likes·6 comments