‹ All Posts
ArthavrkshRA

12 mins ago · SEBI Registration INH000025212

Nifty IT Ends Week Near Inverse H&S Neckline

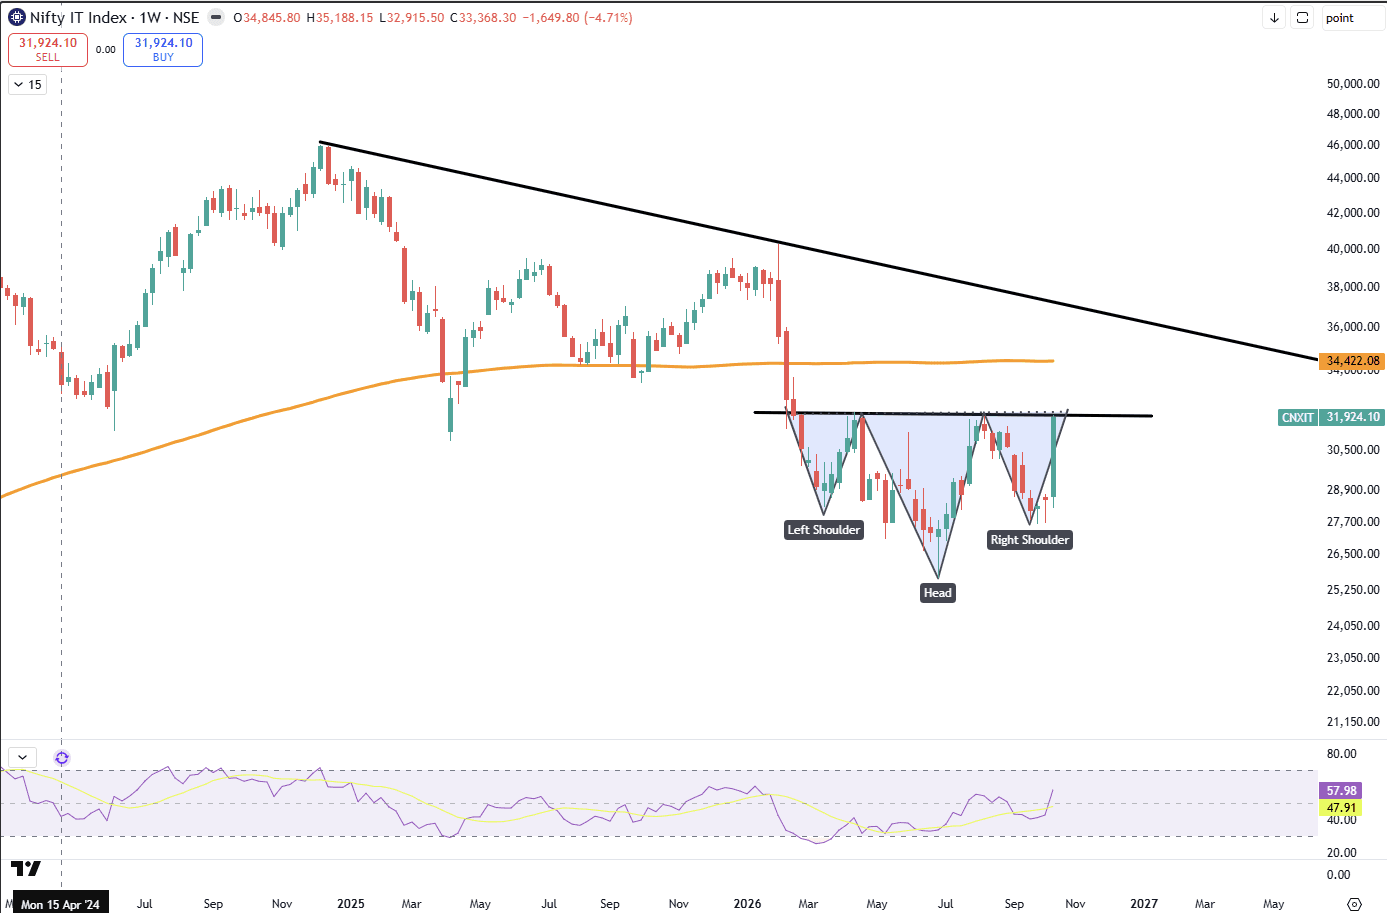
Nifty IT is up 11.72% this week and settled near 31,924, right at the neckline of a possible inverse head and shoulders on the weekly chart. The structure can be read this way: the left and right shoulders sit near the 28,300 zone, with the head formed by the lows near 25,000-26,000 in June. The double bullish hammer near 28,300 marked the right shoulder. Price is also testing the 50-week average (31,857), just below the 32,130 resistance. RSI at 57.98 has moved above the midline. The move has been broad.
TCS
has gained around 15% this week, Tata Elxsi 23%, Tech Mahindra 18% and Infosys 13%. Levels: resistance at 32,130, then the 200-week average near 34,400. Support at 31,290, 30,100 and 28,300. A sustained weekly close above the neckline would keep the 200-week average in view. A slip back below 31,290 would put the pattern on hold. An inverse head and shoulders matters when price closes above the neckline and sustains it, and the weekly timeframe adds weight to the signal. Disclaimer:This is for educational purposes only and is not investment advice. Please consult your financial advisor before making any investment decisions. SEBI Registered Research Analyst — INH000025212.

#TechnicalViews#Post-ClosingCommentary#TrendingSectors#IndexStrategies#EquityResearch
16102026Nifty IT.png
1 like·2 comments