‹ All Posts
ArthavrkshRA

9 mins ago · SEBI Registration INH000025212

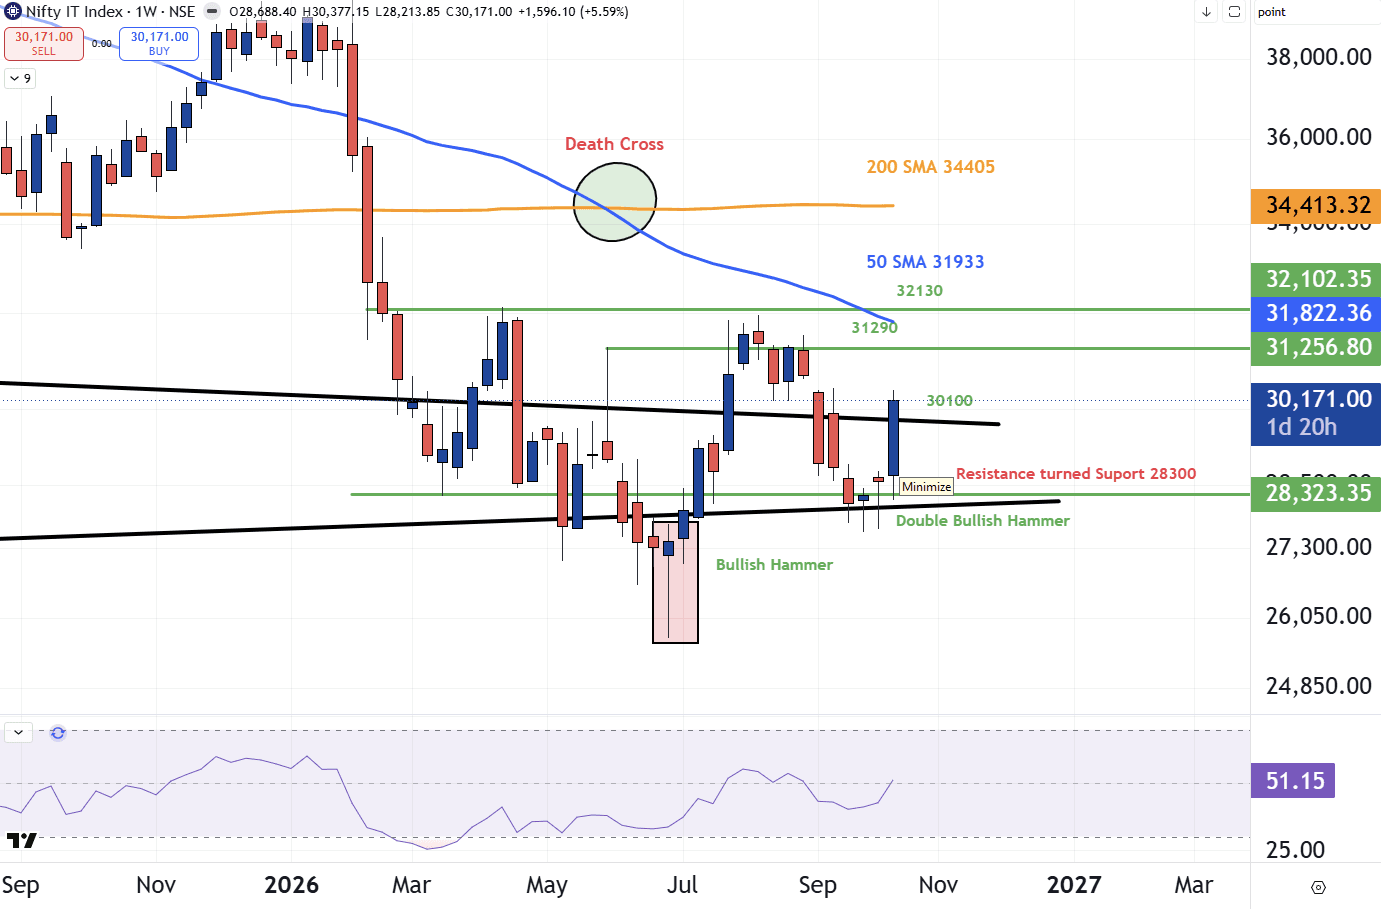
Nifty IT Reclaims 30,100 After Double Hammer

Nifty IT is up 5.59% for the week so far, trading near 30,171 and back above the 30,100 level, which had acted as resistance. The weekly chart shows how this came about. Two consecutive hammer-type candles with long lower shadows formed around the 28,300 zone, a level that has switched between resistance and support and sits close to the lower rising trendline. Buyers stepped in at that support, and this week’s strong candle follows. The move has also been broad. Several IT names, including
TCS
, LTIMindtree, Intellect Design and Tata Elxsi, have gained roughly 6-15% in just three sessions, which suggests interest at lower levels. Levels: resistance at 31,290, then 32,130. Support at 30,100, then 28,300. RSI at 51.15 has moved just above the midline. The 50-week average (31,933) and 200-week average (34,405) still sit above price, and the earlier death cross keeps the larger trend in view. Hammer candles near a tested support show buyers stepping in, and a move above resistance adds weight, but longer-term averages still frame the bigger picture. Disclaimer:This is for educational purposes only and is not investment advice. Please consult your financial advisor before making any investment decisions. SEBI Registered Research Analyst — INH000025212.

#TechnicalViews#Post-ClosingCommentary#EquityResearch#IndexStrategies
14102026 Nifty IT.png