‹ All Posts
ArthavrkshRA

18th Aug · SEBI-Registered Analyst

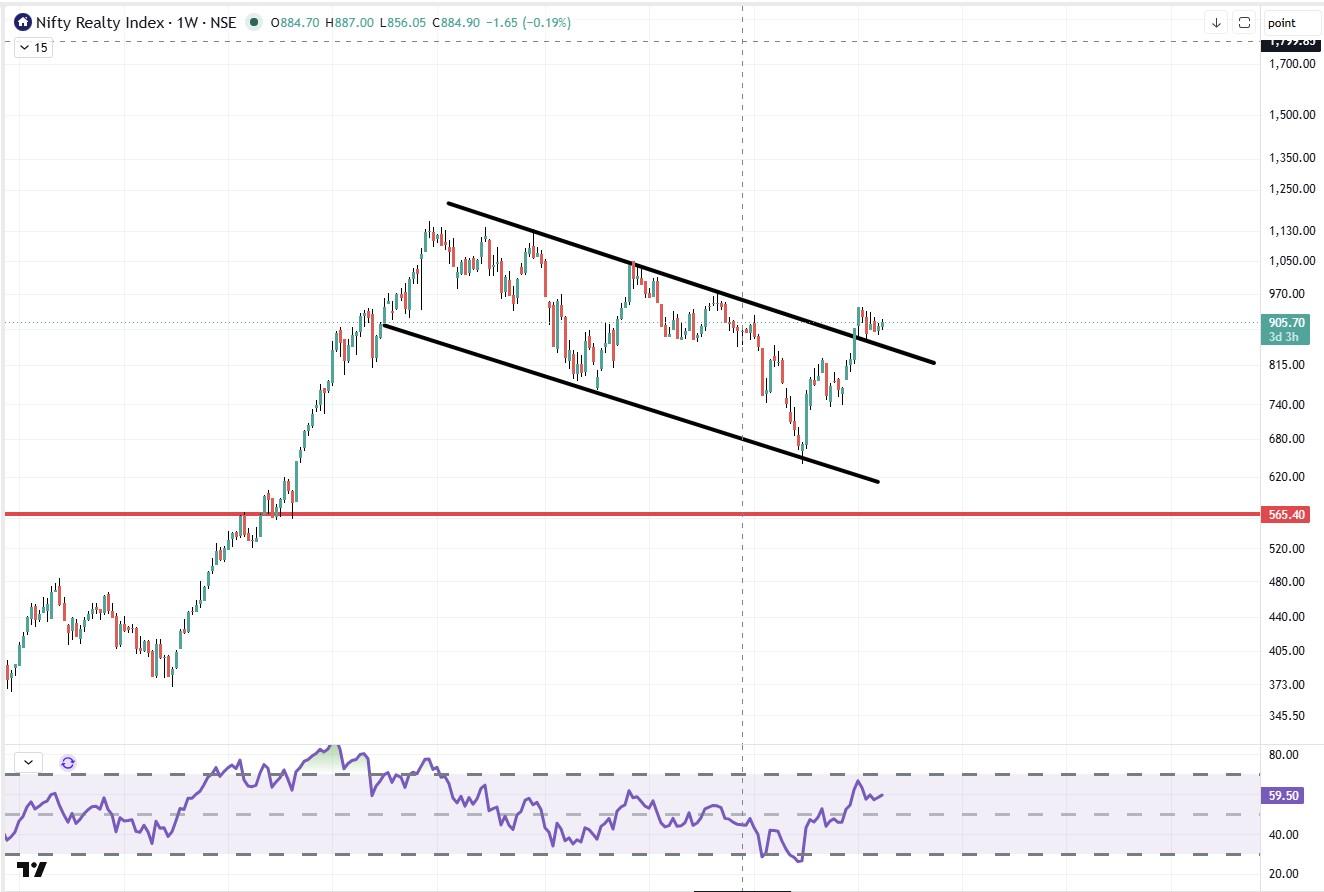
Nifty Realty Breaks Falling Channel, DLF Confirms with Triangle Breakout

Nifty Realty has broken out of its multi-month falling channel on the weekly chart, decisively clearing the channel's upper resistance band near 940 and now trading at 1,129 — a strong follow-through that shifts the sector's structure from corrective to potentially trend-reversing. RSI at 59.8 is turning up from a neutral zone, supporting the case for continuation rather than a one-off spike, though a retest of the breakout zone (900–940) as support would be healthier confirmation before chasing strength. Stock to Watch:
DLF
has broken out of a converging triangle on the 4 hour chart, clearing resistance near 661–665 and now trading at 679.75, with RSI at 65 confirming momentum. As long as DLF holds above 665, the setup favors continuation toward 690–720; a slip back below 650 invalidates the breakout. A sector index breaking a multi-month falling channel while its bellwether stock confirms with its own breakout is a stronger signal than either move in isolation — sector and stock-level breakouts reinforcing each other reduce the odds of a false move compared to a single-stock breakout against a still-falling sector trend.

#IndexStrategies#TechnicalViews#StockInNews#Today’sTradingSetup#SectorBreakouts
Nifty Realty Index.jpg
853 likes·48 comments