‹ All Posts
ArthavrkshRA

2 hours ago · SEBI Registration INH000025212

Reliance Update: Sharp Weekly Bounce From D Zone

On 31 Oct, after
RELIANCE
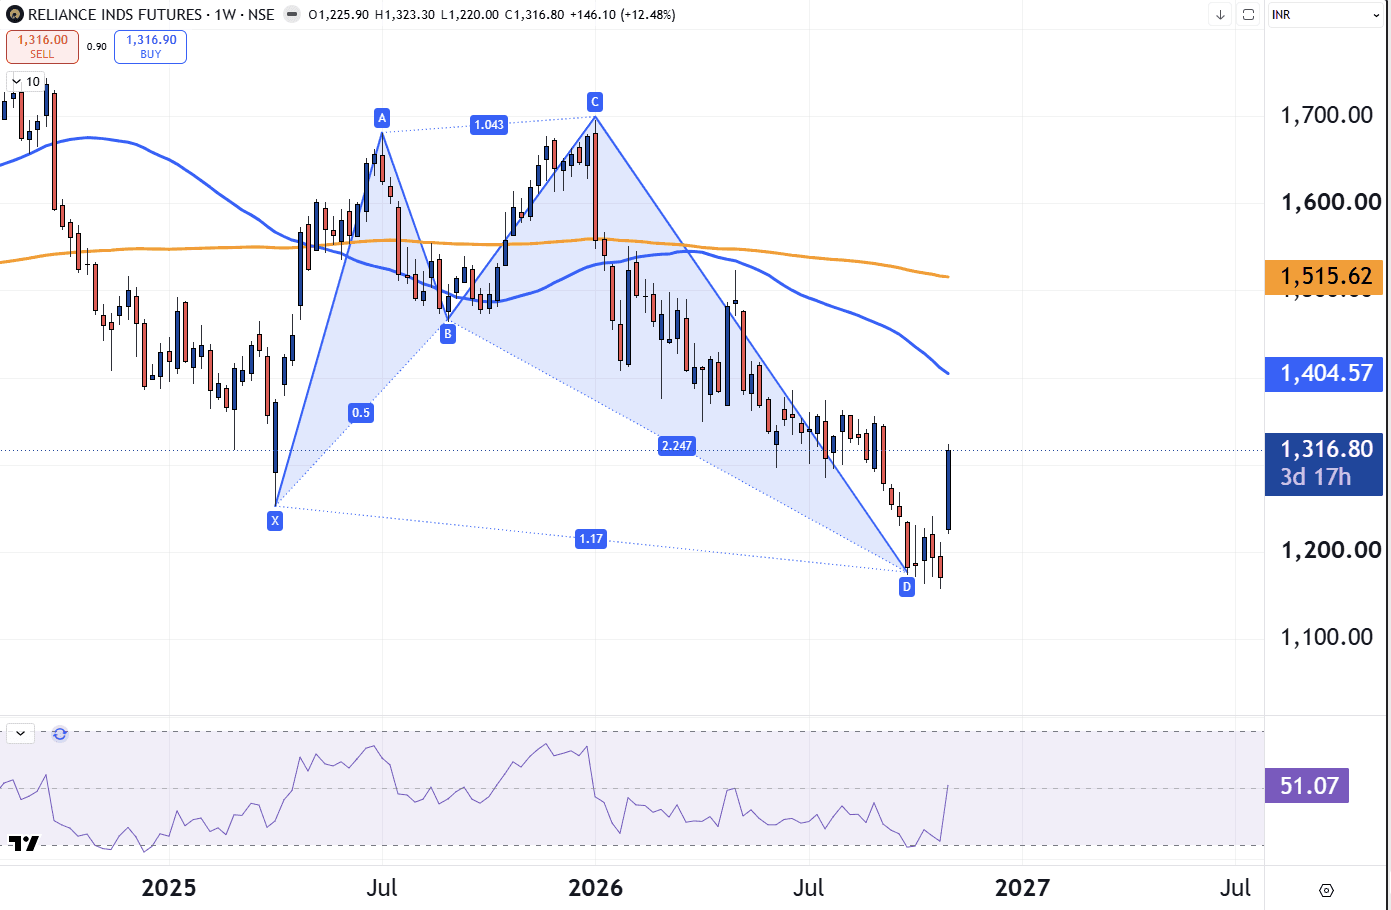
’s Q2 results, we had highlighted a harmonic XABCD structure with the stock near point D on the weekly chart, with RSI close to oversold. This week the stock is up over 12% on the weekly futures chart, trading near 1,317 against a previous weekly close near 1,171. The week’s candle has moved well above the range of the last few weeks, and RSI has recovered to about 51. On the chart, the next references are the 50-week SMA near 1,405 and the 200-week SMA near 1,515. The point D area near 1,170 is the level to watch on the downside. The weekly candle is still forming, so the closing level matters. After a sharp move, some consolidation is common, and how the stock holds this week’s gains is worth observing. A sharp bounce from a technical zone is a first sign of change; follow-through, closing levels and moving-average resistance show whether the move can last. Disclaimer: This is for educational purposes only and is not investment advice. Please consult your financial advisor before making any investment decisions. SEBI Registered Research Analyst — INH000025212.

#StockInNews#Post-ClosingCommentary#TechnicalViews#EquityResearch
04112026Reliance update.png
40 likes·39 comments