‹ All Posts
ArthavrkshRA

19 mins ago · SEBI Registration INH000025212

Why Chart Patterns Matter: TCS Inverse H&S Case

Chart patterns matter because they turn noisy price action into a structured story about who is in control. An inverse head and shoulders, for example, shows sellers failing to push price lower on three successive attempts. The middle low, the head, is followed by a higher low on the right shoulder, which suggests selling pressure is fading.
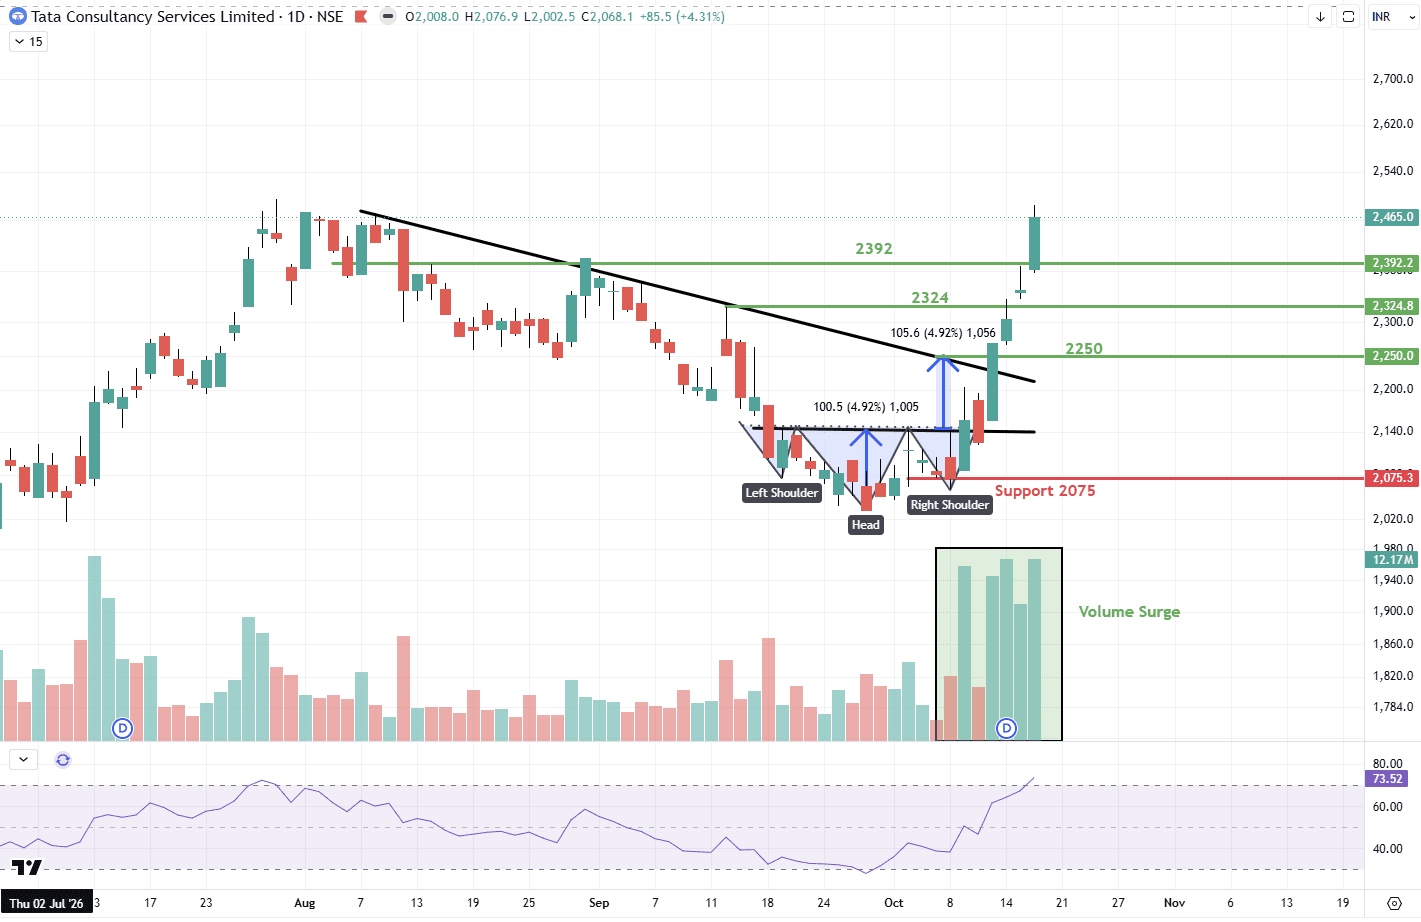
TCS
(daily) is a recent illustration. The stock formed an inverse head and shoulders, then moved above its neckline and above a falling trendline drawn from the August highs, on a visible volume surge. Each element adds a layer. The pattern shows the base, the trendline break shows a change in the larger downtrend, and volume shows participation behind the move. This is why analysts prefer confirmations that agree with each other over any single signal. A pattern also defines what would prove the idea wrong, which keeps expectations realistic. After an extended move, RSI has entered the overbought zone, a reminder that strong moves often pause or revisit broken areas before the next phase. Chart patterns organise price action into a clear story, and they work best when the pattern, trendline break and volume all point the same way. Disclaimer:This is for educational purposes only and is not investment advice. Please consult your financial advisor before making any investment decisions. SEBI Registered Research Analyst — INH000025212.

#TechnicalViews#EquityResearch
18102026TCS.png
2 likes·2 comments