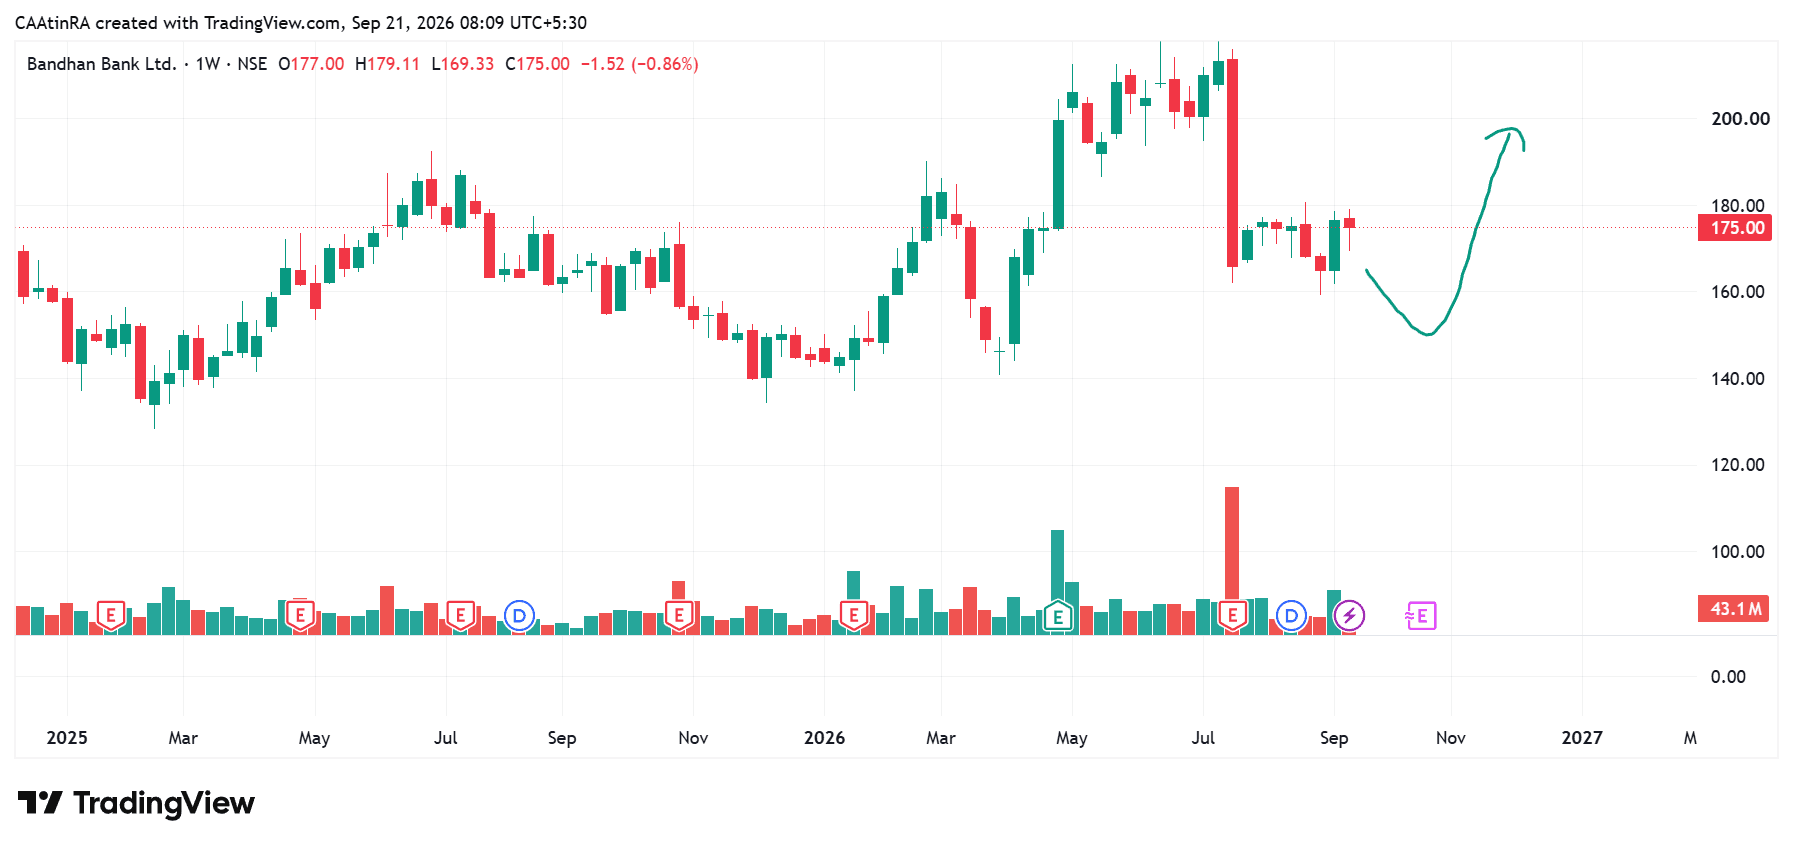
As of the latest available close: 18 September 2026, Bandhan Bank closed at ₹175.00. The stock gained 2.04% on the session, with an intraday range of ₹172.50–₹178.30.
1. Fundamental picture
Bandhan Bank's Q1 FY27 numbers show a mixed but improving picture:
Advances: ₹1.56 lakh crore, up about 16% YoY
Deposits: ₹1.65 lakh crore, up about 7% YoY
NII: ₹2,921 crore, up 5.9% YoY
PAT: ₹502 crore, up about 35% YoY
NIM: 6.2%
Gross NPA: 3.1%
Net NPA: 0.9%
RoA: 1.0%
RoE: 7.7%
2. What needs monitoring
The headline PAT growth should not be viewed in isolation.
NIM at 6.2% was lower YoY, while non-interest income declined nearly 17% YoY. Also, deposit growth of roughly 7% was significantly below advances growth of roughly 16%, which makes deposit mobilisation and funding mix important variables to monitor.
A positive structural development is the continued diversification toward secured lending. The secured loan mix increased to 56.8% from 52.1% a year earlier, while retail deposits grew around 15.6% YoY.
3. Technical view
The stock closed at ₹175 on 18 September, after trading between ₹172.50 and ₹178.30.
For the week of 21–25 September 2026, one published technical framework identifies:
Immediate support: ₹169.85
Major support: ₹164.70
Immediate resistance: ₹179.63
Next resistance: ₹184.26
Higher resistance: ₹189.41
4. SEBI RA commentary
My reading of Bandhan Bank is that the story is currently one of transition: asset quality and loan-book diversification are showing improvement, but profitability ratios, margins and the deposit-versus-advance growth gap still require close monitoring.
Research Analyst Disclosure: This is a factual research commentary based on publicly available company disclosures and market data. It should not be construed as a guarantee of future price performance. Investors should consider their own objectives, risk profile and independent analysis before taking any investment decision.