
‹ All Posts
CA Omkar Bhutada - SEBI Reg IA

15th Jul 2025 · SEBI-Registered Analyst

AARTI DRUGS LTD – Trend & MACD Bullish Setup (Weekly Chart)
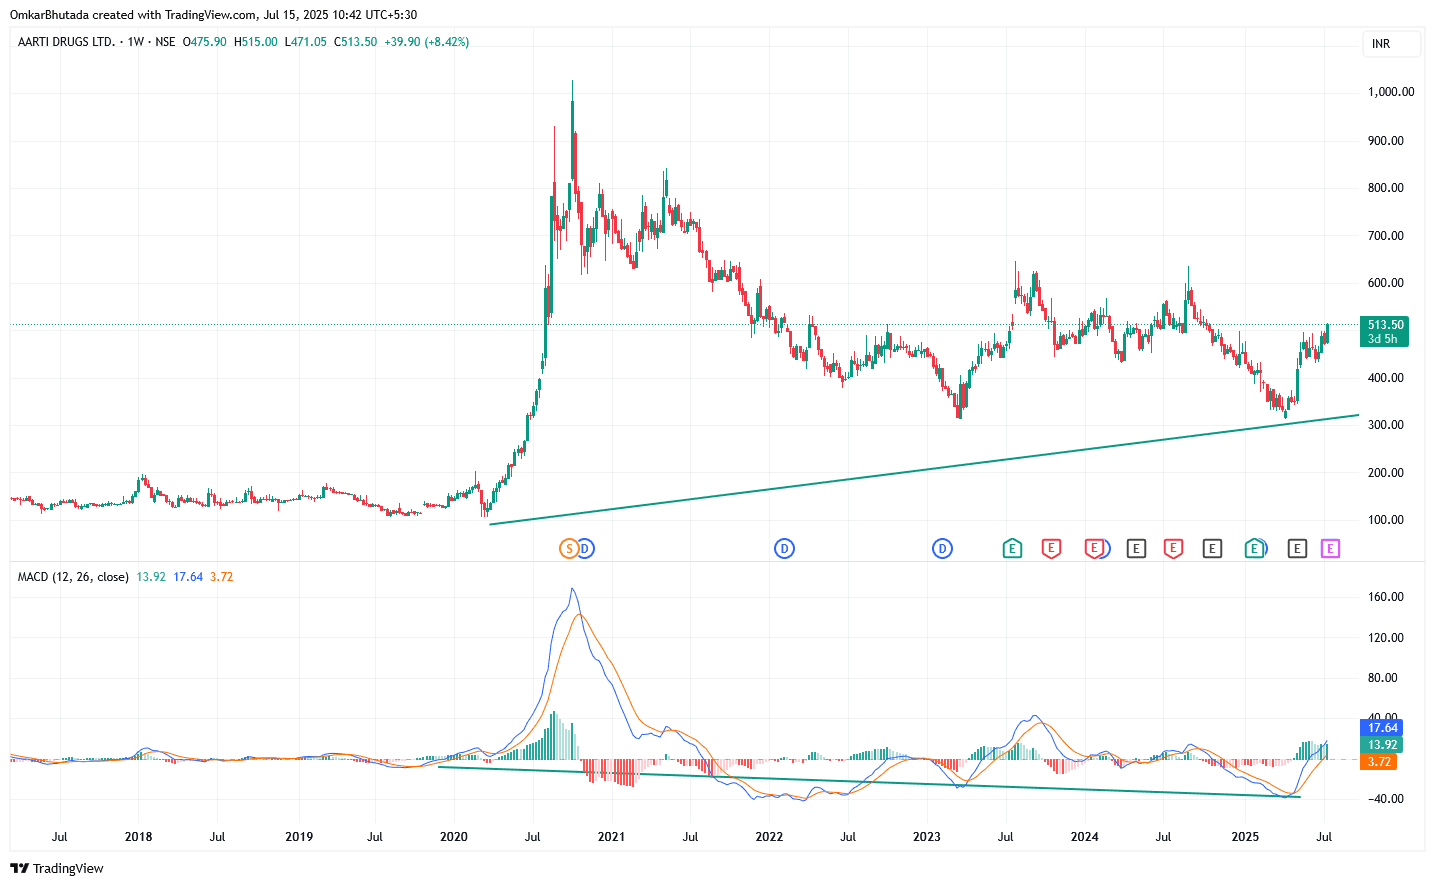
AARTIDRUGS
🔍 Technical Highlights: 📊 Price Structure: Stock is showing a strong bounce from long-term trendline support (drawn from 2020 low). Multiple bottom formations between ₹375–₹400 area. Higher lows have been maintained on a structural basis. 📉 MACD Indicator: Clear MACD positive divergence — price made similar/lower lows while MACD made higher lows. MACD line (blue) has crossed above signal line (orange) from below zero — strong bullish signal. Histogram also flipping positive, indicating growing momentum. 🔎 Chart Interpretation: Indicator Observation Price Action Breakout from sideways range Trendline Support Held consistently since 2020 MACD Divergence Bullish Divergence + Crossover Structure Ascending Triangle on longer timeframe 🎯 Potential Targets: If follow-through is strong: Resistance Zone: ₹600–₹620 (intermediate supply zone) Extended Target: ₹700+ (if breakout above ₹620 sustains) Stop-loss Zone: ₹460–470 (below recent breakout candles) ✅ Conclusion: AARTI DRUGS is showing classic bullish divergence confirmation with a breakout from base, supported by improving MACD structure. It's forming a solid bottom base with room for upward momentum. Ideal setup for swing to medium-term move, especially if ₹520+ is held.

#WatchOutFor#StockInNews#TechnicalViews#FundamentalViews#EquityResearch
AARTIDRUGS_2025-07-15_10-42-35.png
1,033 likes·66 comments