
‹ All Posts
CA Omkar Bhutada - SEBI Reg IA

19th Aug 2025 · SEBI-Registered Analyst

"Alkem Laboratories: Rectangle Breakout on the Horizon?"
ALKEM
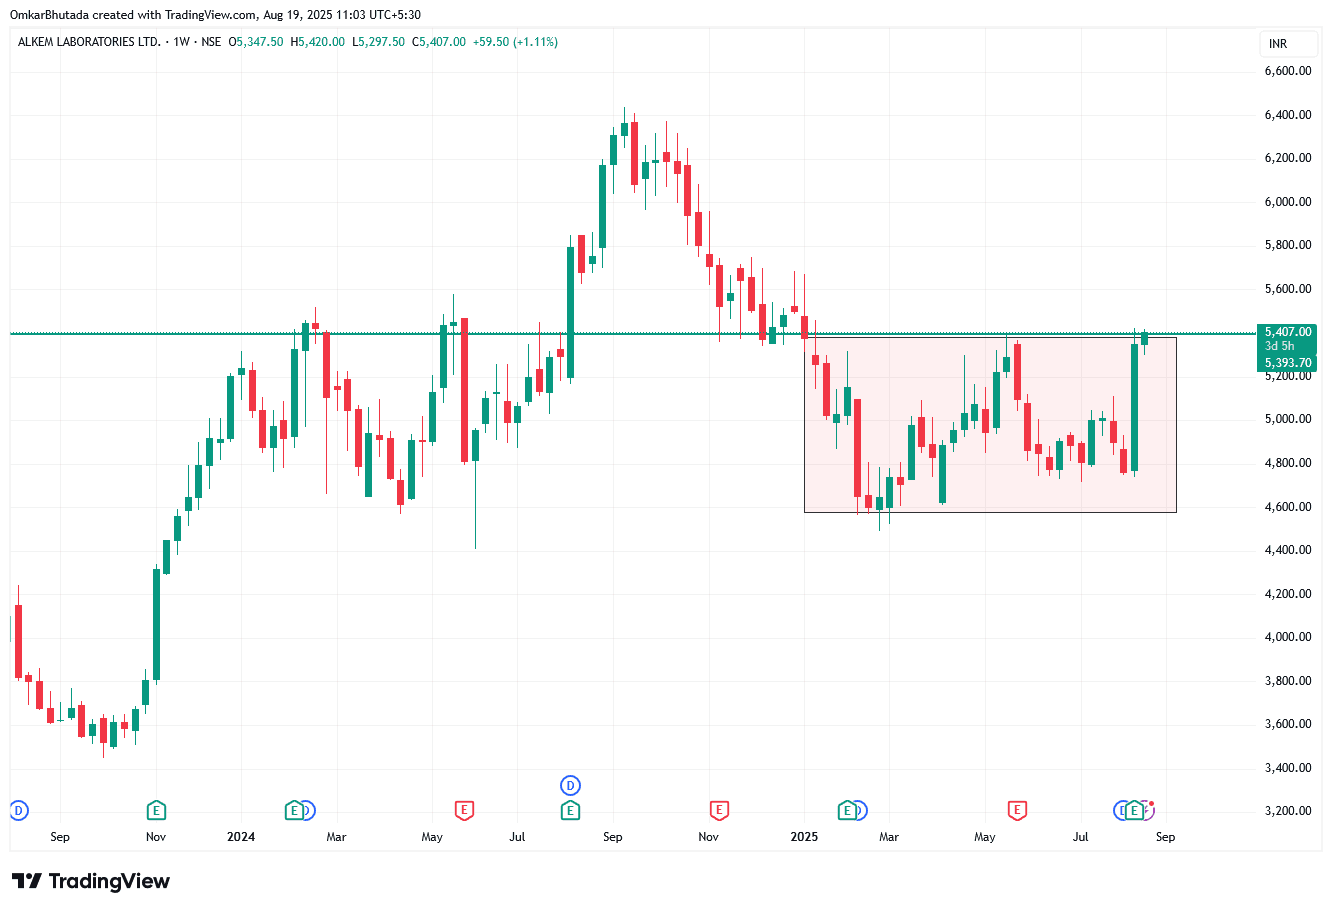
📊 Technical View 1️⃣ Price Action: After a strong rally till ~₹6,500 (late 2024), stock corrected and then consolidated inside a rectangle pattern between ~₹4,650 (support) and ~₹5,400 (resistance) for almost 9 months. Now, price is testing the upper boundary of the rectangle (~₹5,400). 2️⃣ Pattern Analysis: Rectangle is a continuation/accumulation pattern. A decisive breakout above ₹5,400–5,450 with volume could open the path for ₹5,800 → ₹6,500 retest. If resistance holds, stock may remain sideways in the rectangle. 3️⃣ Key Levels: Breakout level: ₹5,400–5,450 Upside targets: ₹5,800 / ₹6,500 Support zone: ₹4,650 (rectangle bottom) Trend invalidation: Close below ₹4,650 📈 Learning Takeaway This is a textbook rectangle formation on weekly charts. Breakout above ₹5,450 → fresh uptrend resumes. Rejection → sideways action continues.

#Today’sTradingSetup#StockInNews#WatchOutFor#FundamentalViews#TechnicalViews
ALKEM_2025-08-19_11-03-02.png
435 likes·70 comments