‹ All Posts
CA Omkar Bhutada - SEBI Reg IA

29th Jul 2025 · SEBI-Registered Analyst

Analysis of Tata Chemicals

TATACHEM
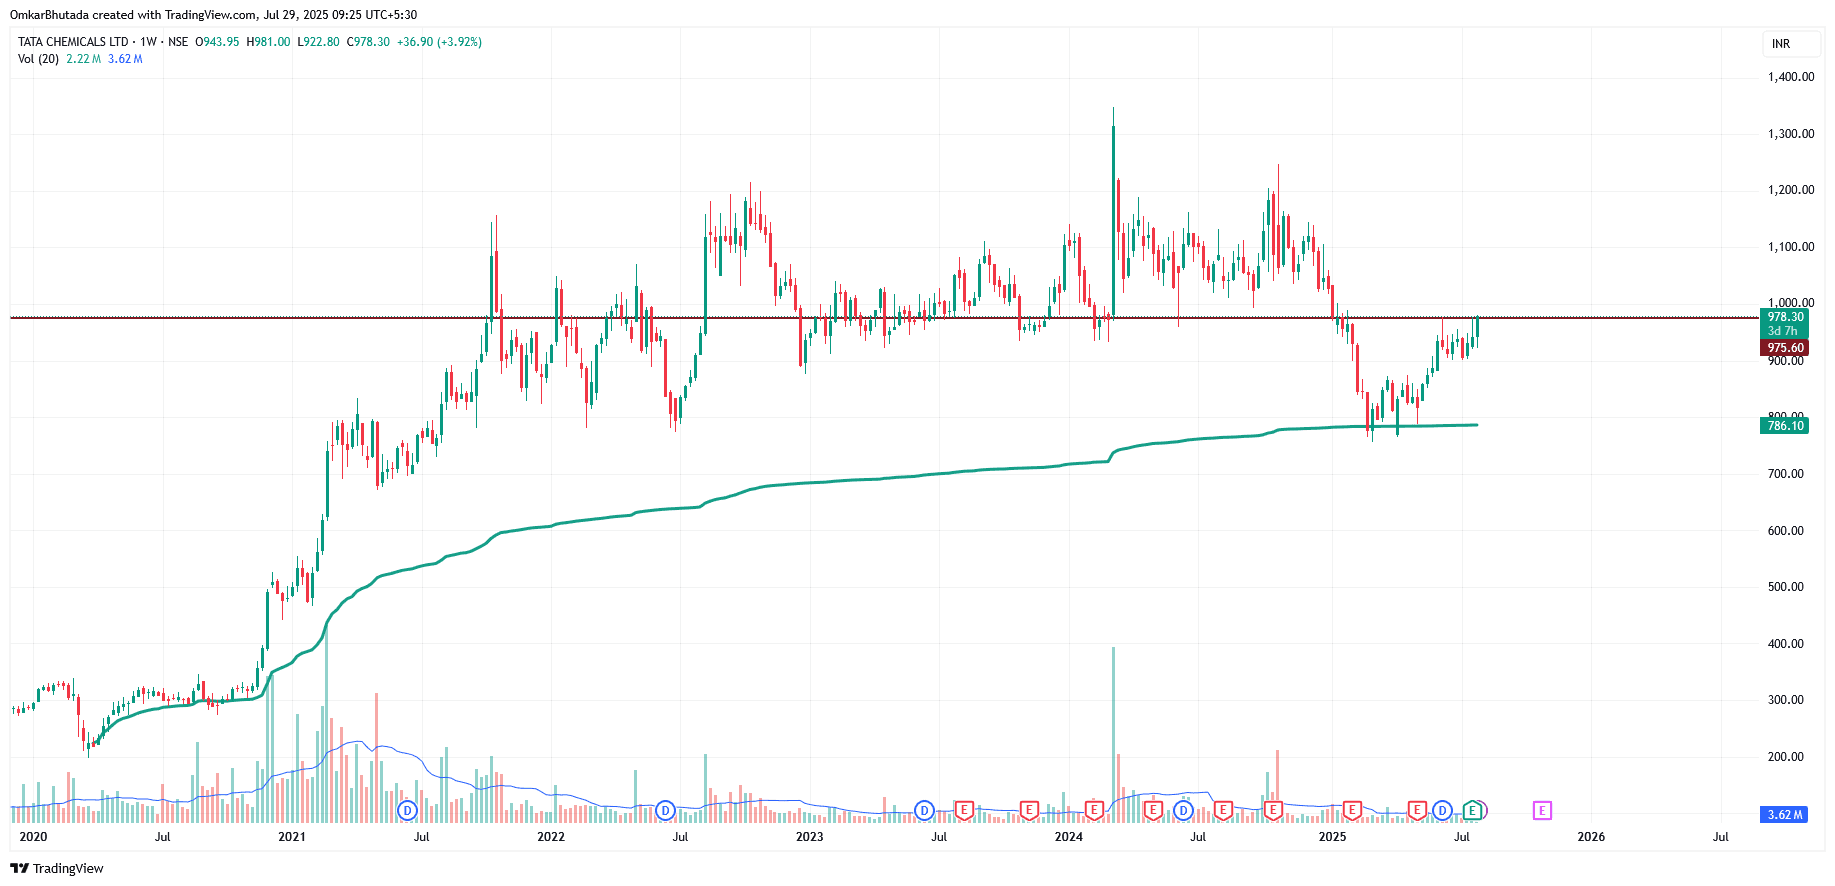
🧭 Chart Type & Timeframe Timeframe: Weekly Chart Indicators Shown: Volume Long-term Moving Average (~200WMA or 200EMA) Key horizontal resistance near ₹975–980 🔍 Technical Observations 🔸 1. Major Resistance Zone at ₹975–980 The price is currently testing strong horizontal resistance. This level has acted as: Resistance: multiple rejections over the past 3 years (2021–2024). Support turned resistance: Prior base before breakdown in 2023. A weekly close above ₹980 can trigger a fresh breakout. 🔸 2. Price Action Current price: ₹978.30 Candle: Bullish with strong body (+3.92%) Bounce from long-term support zone around ₹850–875 is visible. Structure suggests a potential "base formation" nearing completion. 🔸 3. Volume Analysis Rising volume with the current candle is a positive confirmation. No extreme volume spikes — healthy and steady accumulation. 🔸 4. 200-Week MA Support The price respected and bounced from the long-term moving average (~₹786), indicating strong long-term investor interest. Acts as a solid trend confirmation indicator.

#Today’sTradingSetup#WatchOutFor#StockInNews#FundamentalViews#TechnicalViews
TATACHEM_2025-07-29_09-25-32.png
768 likes·48 comments