23rd Jun · SEBI-Registered Analyst
Currency Grow (CA & SEBI Reg IA Omkar Bhutada) · 23rd Jun
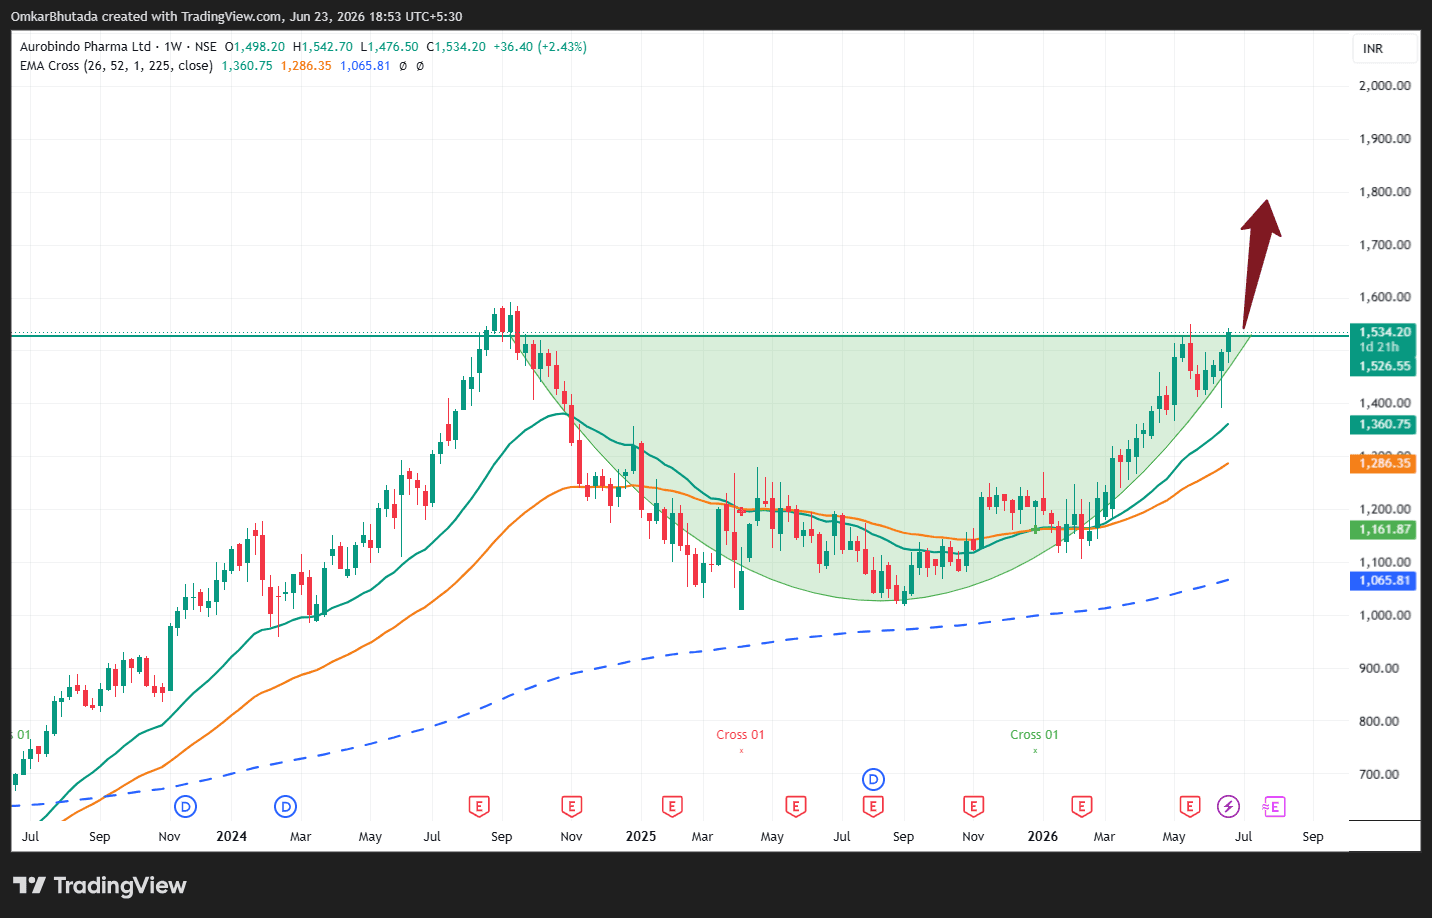
Aurobindo Pharma (Weekly Chart) – Technical View
$AUROPHARMA The chart is showing one of the cleaner long-term continuation setups among the stocks you've shared. What I Like ✅ Large Cup Formation Completed The stock peaked around ₹1,525–1,550 in 2024. Spent several months consolidating and building a rounded base. Has now returned to the prior high zone. ✅ Breakout Attempt at Major Resistance Current price is around ₹1,534. The stock is testing the same resistance zone that rejected it previously. Weekly close above ₹1,550 would confirm a fresh breakout. ✅ Strong Moving Average Structure 26 EMA > 52 EMA > 225 EMA. All major moving averages are rising. This indicates a strong primary uptrend. ✅ Relative Strength Pharma sector has been showing strength. The stock has outperformed many large-cap peers during the recent market phase. Key Levels Resistance ₹1,550 (major breakout level) Support ₹1,450–1,470 ₹1,360 (26 EMA region) ₹1,280 (52 EMA region)