
โ€น All Posts
CA Omkar Bhutada - SEBI Reg IA

4th Jun 2025 ยท SEBI-Registered Analyst

๐Ÿš€ Breakout from Decade-long Base: Multi-Signal Confirmation on RELINFRA!
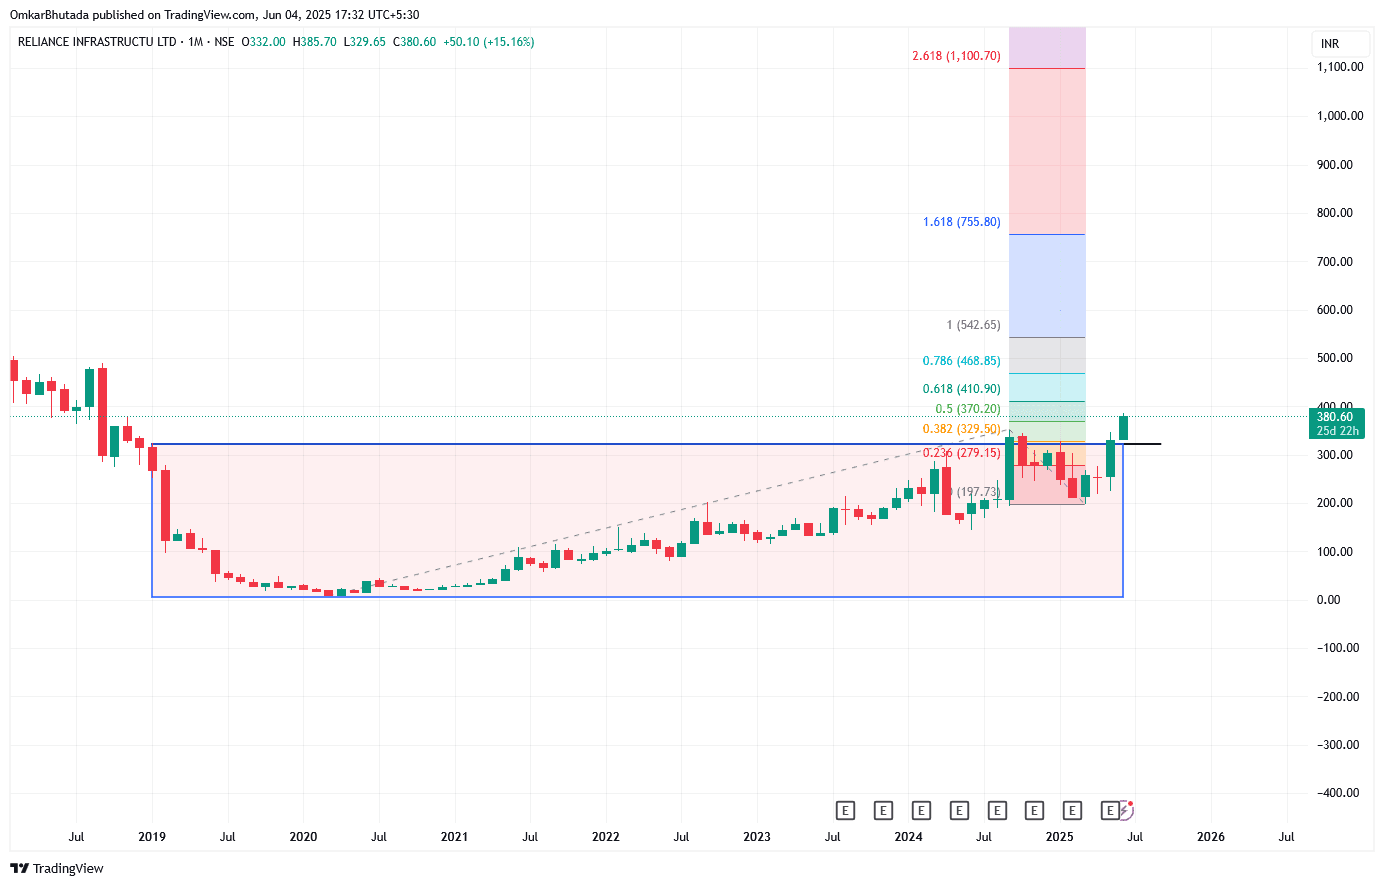
RELINFRA
Technical Analysis: ๐Ÿ“Š Chart Structure: Reliance Infrastructure has broken out of a multi-year cup and handle base formation on the monthly chart, signaling a strong long-term trend reversal. ๐Ÿ“ˆ Elliott Wave Structure: Post a prolonged consolidation from 2018 to 2023, the stock appears to have completed its corrective Phase (Wave 2) and has now potentially entered Wave 3โ€”the most impulsive and rewarding leg in Elliott Wave theory. ๐Ÿ“‰ MACD Divergence: Strong bullish divergence noted in prior months. While price made lower lows near โ‚น197, MACD histogram and signal line remained elevatedโ€”signaling reversal strength building beneath the surface. ๐Ÿงญ AVWAP Levels: Monthly AVWAP from 2018 crash and subsequent consolidation shows โ‚น330โ€“โ‚น350 zone acting as strong support now. Price closing above this region confirms a change in institutional sentiment. ๐ŸŽฏ Fibonacci Targets: Based on Fibonacci extensions from the bottom: 0.618 = โ‚น410 1.0 = โ‚น542 1.618 = โ‚น755 2.618 = โ‚น1,100 First major target: โ‚น410โ€“โ‚น468 zone Ultimate potential: โ‚น755+ in medium to long term, if fundamentals support. Fundamental View: ๐Ÿ“Œ High ROCE & Operating Leverage: With improvement in infrastructure spend, government project visibility, and potential deleveraging, RELINFRA is poised to benefit from strong cash flow conversion and high asset utilization. ๐Ÿ“Œ Turnaround Story in Motion: From past debt issues to recent operational improvements, the stock reflects a classic value-to-growth re-rating opportunity. ๐Ÿ“Œ Consistent Earnings Uptick: Recent quarters have shown steady revenue and margin improvement, making this breakout even more credible.

#FundamentalViews#TechnicalViews#StockInNews#TrendingSectors#EquityResearch
RELINFRA_2025-06-04_17-32-44.png
180 likesยท68 comments